TTM revenue
€39.47bn
ASML makes the machines that print chips. A lithography machine projects the pattern of a circuit onto a silicon wafer, layer after layer, and the finer the pattern it can print, the more transistors fit on a chip. ASML's most advanced machines use extreme-ultraviolet light — EUV — and it is the only company that makes them. Its customers are chipmakers, who buy machines when they build or upgrade a factory and pay to keep the installed ones running and up to date.
Three things follow from that description, and every panel below is downstream of them. First, the company reports in euros and the share on this page trades in dollars, which is a trap for anyone computing a ratio from a data feed: the provider's own P/E divides one currency by the other and comes out at about 47 times, where the same figure in one currency is 41.1 (tab 4 shows the arithmetic). Second, the profit line is growing far faster than sales — over the last twelve months revenue rose 22.54% and net income 42.39%, on a net margin of 34.14%. Third, the customers decide when to spend, so the demand comes in cycles: in 2024 revenue grew 2.56% and net income fell 3.41%. Whether today's earnings are a new level or the top of a cycle is the argument the valuation panel and the risk panel are having with each other.
The share is $1,650.00, 67.82% above where it traded a year ago and 17.50% below its June high. Yesterday the company reported earnings per share 19.31% above the estimate, and the share closed 3.94% lower on twice its usual volume. That is the page's finding in one sentence, and tab 9 shows it is not a one-day oddity: across the last five reports, the size of the beat and the direction of the move have nothing to do with each other.
What this method is for: to hold the whole company in view at once, so that no single strong number — a growth rate, a multiple, a chart — gets to decide the question by itself.
Machines and the service of machines. ASML sells lithography systems to chipmakers and then maintains, upgrades and supports the ones already installed in their factories. Our data holds the two as one revenue line, so the split between a one-off machine sale and the recurring service income is not on this page (see the box below). What the figures do show is the scale and the shape, in the euros the company reports in: trailing twelve-month revenue of €39.47bn against €32.21bn in the prior twelve months, +22.54%; gross margin 54.34%, operating margin 38.55%, net margin 34.14%. A manufacturer of industrial machinery that keeps a third of its revenue as profit is not an ordinary manufacturer.
The moat is technology, and at the leading edge it is complete: nobody else makes an EUV machine, so a chipmaker that wants to print the finest circuits buys from ASML or does not print them. Around that sits a switching cost of the heaviest kind — a chip factory's processes are built and qualified around its tools, and the tools are serviced by their maker for as long as they run. Scored on tab 3. What the moat does not protect is the timing of demand: it decides who gets the order, not when the customer places it. That is why the cycle, not a competitor, ranks first on tab 5.
Semiconductor equipment is a capital-spending business: its revenue is other companies' investment budgets. When chipmakers build, it grows quickly; when they pause, it does not, whatever the quality of the machine. Our own three years show both halves. In 2024 revenue grew 2.56% and net income fell 3.41%; in the third quarter of 2026 revenue grew 55.16% and net income 133.49% against the same quarter a year earlier. The industry argument of the moment is whether demand for the most advanced chips has made that cycle shallower. The figures on this page cannot settle it, because the number that would — the order book — is not in our data.
Improving on every line we hold, from a soft year. Operating margin was 32.81% in 2023, 31.92% in 2024, 34.60% in 2025, 38.55% over the trailing twelve months and 44.36% in the third quarter of 2026 alone. Gross margin over the same steps: 50.21%, 49.82%, 52.83%, 54.34%, 57.45%. A business whose margins rise this fast with its revenue is one whose costs are largely fixed — which is also what makes the earnings fall faster than revenue when the cycle turns. The numbers, year by year, are on tab 2. What we cannot assess is the balance sheet.
The provider's computed P/E for this company is about 47. It is wrong, and not because of the provider's arithmetic: it divides a dollar price by euro earnings. Measured in one currency the trailing P/E is 41.1, and tab 4 shows the four numbers it is built from. We do not hold a peer set, so this page does not print an "equipment makers trade at 30×" it cannot source. What tab 4 does instead is turn the question around: given the price, what growth is already assumed? Every step of that arithmetic uses figures we hold, in dollars throughout.
Earnings are accelerating faster than the market is willing to pay for them. The trailing multiple fell from 56.7 to 41.1 in three months while dollar earnings per share rose 25.34%, and tab 4 shows the price needs revenue growth of about 6.2% a year to justify 30× in five years — against 22.54% over the last twelve months.
What has to be true: revenue keeps growing at a double-digit rate through the next reports — the January estimate is $16.10bn, 38.71% above the same quarter a year earlier — and operating margin stays near the trailing 38.55% rather than returning to 2024's 31.92%.
This is what the top of an equipment cycle looks like: revenue up 55.16% in a quarter, margins at the highest point in the table, a record beat — and a market that sold it. The multiple has been falling because the market is pricing the next soft year, not the last strong quarter, and 2024 shows what a soft year does to the earnings of a business with fixed costs.
What has to be true: chipmakers' spending pauses the way it did in 2024 — revenue flat, net income down — and the market prices the trough rather than the peak. The order book would show it first, and our data does not hold the order book.
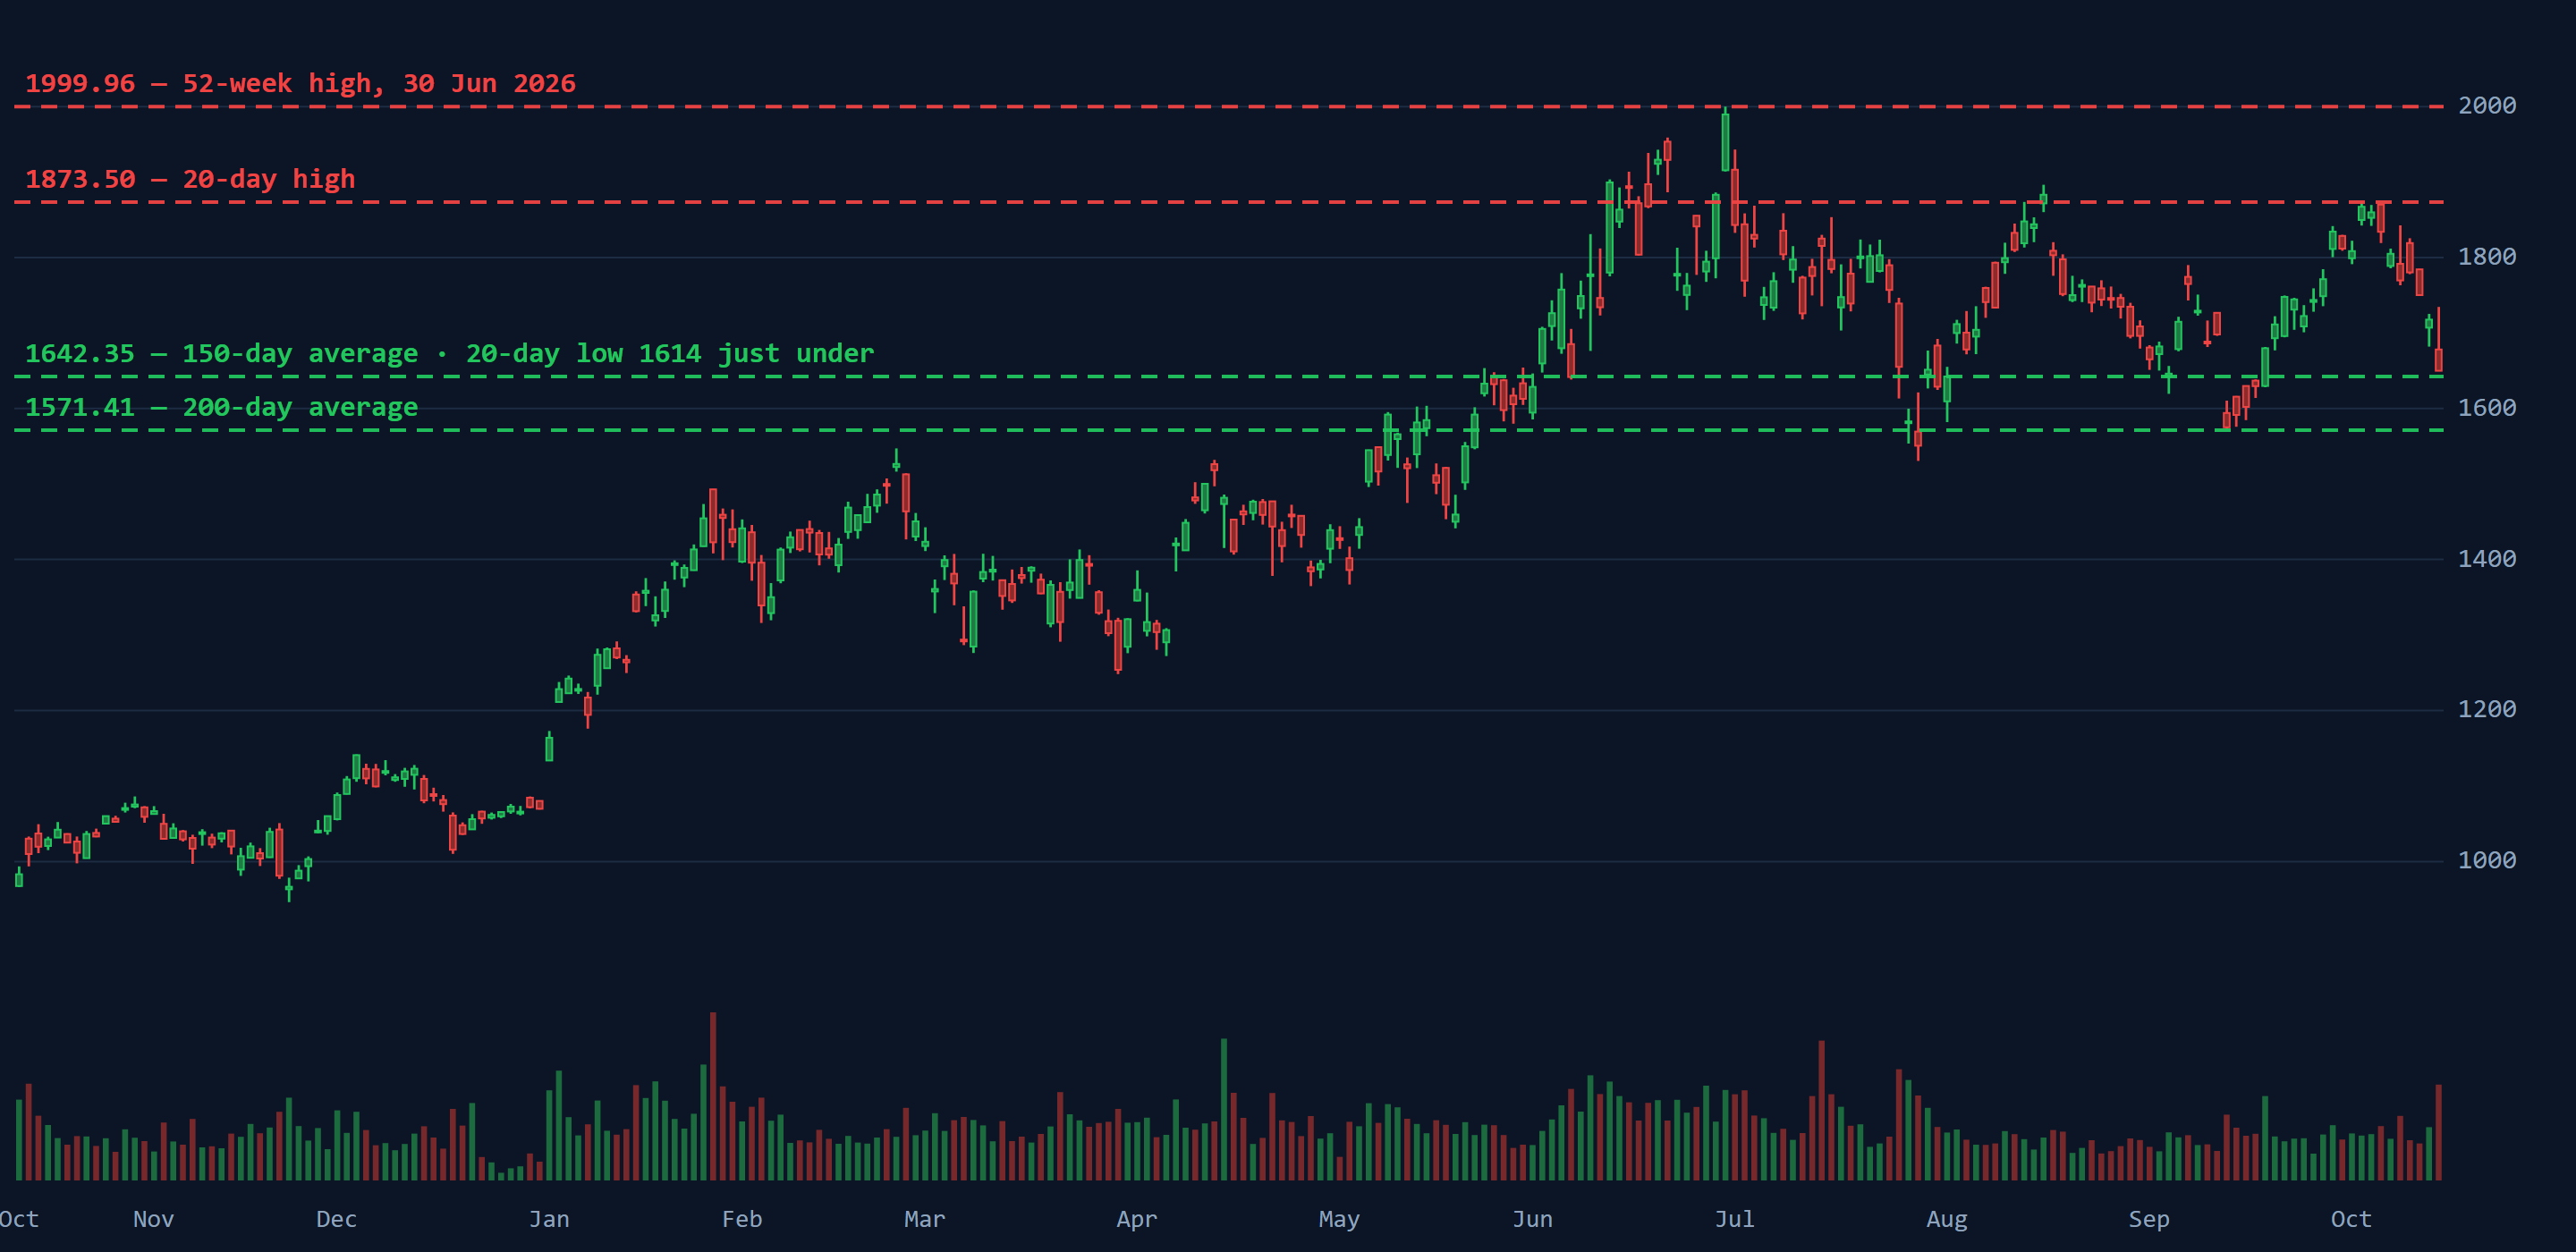
Neither case resolves in one report. Earnings keep arriving, the multiple keeps being argued over, and the share trades on what each quarter implies about the next year rather than on the quarter itself. The $1,614.02 20-day low, with the $1,642.35 150-day average just above it, and the $1,873.50 20-day high on the chart are the practical boundaries of that argument.
This page does not forecast a price. What it can say is which number will settle the argument. The number ASML's own investors would name is order bookings, and our data does not carry it. Of the numbers we do hold, the one that decides between the bull and the bear is revenue growth against the same quarter a year earlier, reported quarterly — because a cycle announces itself there before it reaches the margin. The next report is 27 January 2027, the fourth quarter: EPS estimate $15.56, revenue estimate $16.10bn, which would be 38.71% above the $11.61bn of the same quarter a year earlier.
What this method is for: to see whether the company is getting stronger or weaker over years rather than quarters, by reading growth, margin and earnings as one sequence instead of three headlines.
| Period | Revenue | Gross margin | Operating margin | Net income | Net margin | EPS | EBITDA |
|---|---|---|---|---|---|---|---|
| FY2023 | €27.56bn | 50.21% | 32.81% | €7.84bn | 28.44% | €19.89 | €10.02bn |
| FY2024 | €28.26bn | 49.82% | 31.92% | €7.57bn | 26.79% | €19.24 | €10.11bn |
| FY2025 | €32.67bn | 52.83% | 34.60% | €9.61bn | 29.42% | €24.71 | €12.43bn |
| Prior TTM, to Q3 2025 | €32.21bn | — | — | €9.46bn | 29.38% | €24.22 | — |
| TTM, to Q3 2026 | €39.47bn | 54.34% | 38.55% | €13.47bn | 34.14% | €35.00 | €16.40bn |
From €27.56bn in 2023 to €28.26bn in 2024 is 2.56%; to €32.67bn in 2025 is 15.58%, a two-year compound rate of 8.88%. The trailing twelve months grew 22.54%, and the third quarter of 2026 55.16% against the same quarter of 2025. Each window is faster than the longer one before it. Read as a sequence it is a sharp acceleration; read as a shape — a flat year, then a surge — it is also exactly what one turn of an equipment cycle looks like. The sequence cannot tell the two apart on its own.
Net income was €7.84bn in 2023, €7.57bn in 2024 (−3.41%, on revenue up 2.56%), €9.61bn in 2025 (+26.91%, on revenue up 15.58%) and €13.47bn over the trailing twelve months (+42.39%, on revenue up 22.54%). EPS: €19.89, €19.24, €24.71, €35.00. In every period the earnings swing harder than the revenue: when revenue grew a little they fell, and when it grew 22.54% they rose 42.39%. That is operating leverage: a cost base that does not shrink when sales slow and does not grow as fast when they rise. It is why the last twelve months look so good, and it is the same arithmetic that took net income down in a year when revenue still grew.
Gross margin is up 7.63 points from 2024 to the third quarter of 2026 and operating margin 12.44. One more line deserves a reader's attention. In the third quarter net income was 95.89% of operating income, against 85.03% for 2025 and 88.54% over the trailing twelve months — so something between operating profit and net profit was unusually favourable that quarter. Our data does not itemise the tax, finance and other lines between the two, so this page cannot say what it was, only that part of the quarter's net-income growth did not come from operations.
The rule of 40 is a convention for subscription businesses; it does not apply to an equipment maker that sells machines into a cycle, and this page skips it.
Strong on every line we hold, and at the top of its own table. Revenue accelerating, margins at their highest, earnings growing nearly twice as fast as sales. This method also shows, in 2024, what the same structure does in a soft year, and it cannot tell you whether the price already knows all of that — that is tab 4's job.
What this method is for: to ask why the company's profits should still exist in ten years, since anything profitable and unprotected gets competed away.
At the leading edge there is no second supplier. ASML is the only company that makes EUV lithography machines, the tools that print the finest features on today's most advanced chips. The advantage is not a patent that expires; it is decades of engineering, a supply chain built around one product and the accumulated knowledge of making it work in a customer's factory. A competitor would need all three, and the first of them cannot be bought. This page describes the position in words because our data holds no market-share figure — but at the leading edge there is no share to divide.
A chip factory's processes are designed, tested and qualified around the tools in it. Replacing a lithography supplier is not a purchasing decision; it is re-engineering the production line, and at the leading edge there is nothing to switch to. The installed machines are then serviced and upgraded by their maker for as long as they run, which turns every sale into a long relationship. Our data does not split that service income out, so the size of this source is described rather than measured.
ASML's advantage is not that it makes machines more cheaply than a rival; at the leading edge there is no rival to undercut. What a monopoly supplier has instead is pricing room, and the margin sequence on tab 2 is consistent with it: gross margin from 49.82% in 2024 to 57.45% in the third quarter of 2026. Scored here as moderate, because the margin is evidence of the technology moat rather than a separate one.
Not a consumer brand, and it needs none. It is a brand in the engineering sense: customers commit the most expensive factories in the world to a roadmap they trust the supplier to deliver. That trust is real and earned, but it is a consequence of the technology, and scoring it separately would be counting the same thing twice.
Indirect only. Every machine in the field teaches the maker something about the next one, and suppliers and customers build their own processes around the platform. That is a learning loop and an ecosystem, not a network effect in the strict sense — one chipmaker's machine does not make another's more valuable.
The competition comes in two kinds. In older, less precise generations of lithography the company has competitors and the usual pressure on price. At the leading edge it has none, and the real long-run threat is a well-funded attempt to build an alternative — the kind of project only a government can afford, slow by nature and invisible in any financial statement until it works. The moat's actual limit is elsewhere: it decides who gets the order, not when the customer places it, and not which customers a government permits to buy. Those two risks are ranked on tab 5.
Nine, and the reasoning is the argument rather than the number. A sole supplier at the leading edge, whose customers cannot switch and whose installed base keeps paying for service, is about as strong a competitive position as an industrial company can hold. What keeps it below ten is that the moat protects ASML's share of chipmakers' spending and not the spending itself, and that a government can narrow the list of customers without any competitor lifting a finger.
What this method is for: to separate the company from the price, because a good business bought at the wrong number is a bad investment and the two questions have different answers.
Forty-one times trailing earnings is a growth multiple, on a company whose earnings are currently growing at a rate that justifies one and whose history includes a year when they shrank. Three months ago it was 56.7 times: after the July report the share closed at $1,815.27 and the four reported dollar EPS figures summed to $32.01. Since then trailing EPS rose to $40.12, +25.34%, and the share fell to $1,650.00, −9.10%. A multiple compressing by more than a quarter in a single quarter in which the business did nothing but accelerate is the tension the rest of this panel measures. A dollar P/E for a year ago cannot be computed honestly: our calendar does not carry the three dollar EPS figures before October 2025.
Rather than guess the future and discount it, hold the price still and solve for the growth that would justify it. Every figure in the table is in dollars. The arithmetic: pick a multiple a mature version of this company might trade at in five years, divide today's $1,650.00 by it to get the EPS that would be needed, multiply by the 383.5m shares to get the net income needed, then divide by today's net margin of 34.14% — a ratio, so the same in either currency — to get the revenue needed. Compare that with the $45.67bn of the last four reported quarters ($13.05bn + $10.67bn + $10.34bn + $11.61bn).
| If in 5 years it trades at | EPS needed | Net income needed | Revenue needed at today's margin | Implied revenue growth, per year | Implied EPS growth, per year |
|---|---|---|---|---|---|
| 40× earnings | $41.25 | $15.82bn | $46.34bn | 0.3% | 0.6% |
| 30× earnings | $55.00 | $21.09bn | $61.79bn | 6.2% | 6.5% |
| 25× earnings | $66.00 | $25.31bn | $74.15bn | 10.2% | 10.5% |
| 20× earnings | $82.50 | $31.64bn | $92.69bn | 15.2% | 15.5% |
The two growth columns differ by about three tenths of a point because the calendar's dollar revenue was converted quarter by quarter, at each quarter's rate, while the margin is the euro statement's ratio. The EPS column is the cleaner of the two; neither changes the reading.
How to read that table. It does not say whether the price is too high or too low. It says: for the buyer at $1,650.00 to simply get their money back with the share trading at 30× in 2031, this company has to grow revenue by about 6.2% a year for five years and hold today's net margin. Over the last twelve months it grew 22.54% (in euros), and even the two years to 2025, which include the flat year, compounded at 8.88%. The table only turns demanding at 20×, where the price would need 15.2% a year for five years — below the current rate, above the two-year one. So unlike most growth stocks, the question here is not whether the growth exists today. It is how much of today's margin and growth survives the next turn of the cycle, because the table holds the margin at its highest point.
The method asks for an industry-average multiple. Our data does not carry a peer set for this company, so any "semiconductor equipment trades at 25×" here would be a number I remembered rather than measured, and the whole value of the table above is that it contains none of those. A reader who wants the peer comparison can build it in the app: open the chart's Key stats tab for two or three equipment makers and read the P/E line from the same source for each — and check, for any company that reports outside the United States, that the price and the earnings are in the same currency before trusting the ratio.
What this method is for: to work out what would have to go wrong and how much it would cost, because the size of a loss matters more than its likelihood when the position is large.
Ranked most dangerous first. "Dangerous" here means the product of how likely it is and how much of the share price it would take, not how frightening it sounds.
What this method is for: to ask where the next stretch of revenue would have to come from, and whether there is a plausible place for it to come from.
Accelerating, sharply, in euros. The two-year compound rate is 8.88%, the trailing twelve months 22.54%, the latest quarter 55.16% against the same quarter a year earlier. The caveat is the second cell: the two-year rate includes a year of 2.56%, and the latest quarter is compared with a quarter that was itself only €7.52bn of revenue — so part of the acceleration is the base, not the business.
Tab 4 computed what growth the price assumes; this is the same figure read as an operating question, in dollars. To reach $61.79bn of revenue by 2031 — the 6.2% compound rate the 30× row needs — the company has to add about $16.12bn to the $45.67bn of its last four reported quarters. In euros, the last twelve months alone added €7.26bn over the twelve before them, while 2024 added €0.70bn. That is the whole growth question in two numbers: the requirement is modest against the current rate and not modest against a flat year. The growth case does not rest on the next year; it rests on the average across the next cycle.
The one forward figure our data does hold is the consensus for the next quarter: revenue of $16.10bn, which would be 38.71% above the same quarter a year earlier and 23.34% above the third quarter just reported. It is an estimate, not a measurement, and it is reported on 27 January 2027.
What this method is for: to look at the share the way the people who move it do, since a private investor is trading against institutions and it helps to know what they are solving for.
A fund manager is not answering "is this a good company". They are answering "does this position help the portfolio I have to report on", and those are different questions with different answers.
The only supplier of the machines the most advanced chips cannot be made without, earning a third of its revenue as profit at the top of its own table, and trading 17.50% below its June high because the market has spent three months deciding how much of that profit belongs to the cycle. The position is a bet that the next soft year is shallower than 2024; the evidence is quarterly revenue growth and the order book, and the next reading is 27 January. Sized for the cycle, not for the company.
What this method is for: to force the strongest version of the argument you disagree with, because the case you cannot state is the one that costs you money.
Both analysts below are arguing from the same figures on this page. That is the exercise: identical data, opposite conclusions, and the reader watching where the disagreement actually is.
Start with the quarter: revenue +55.16%, net income +133.49%, operating margin 44.36%, earnings per share 19.31% above the estimate. Over twelve months, net income +42.39% on revenue +22.54%.
And the market has de-rated it while it happened. Since July, dollar earnings per share rose 25.34% and the share fell 9.10%; the multiple went from 56.7 to 41.1. The price has been moving away from the business. That is the setup, not the warning.
That is what the top of an equipment cycle looks like from inside. You are quoting operating leverage at its best moment; 2024 is the same leverage the other way — revenue +2.56%, net income −3.41%. And read the quarter below the headline: revenue came in 0.69% under the estimate, and net income was 95.89% of operating income against 85.03% last year. Part of your record beat came from below the operating line.
The market sold it — 3.94% down on twice the usual volume. It is not ignoring the earnings. It is pricing what comes after them.
Take your cycle to the table on tab 4. At 30× in five years the buyer today needs revenue growth of about 6.2% a year. The two years to 2025 — your flat year included — compounded at 8.88%. The last quarter alone earned $14.52 a share; four of those would be $58.08, more than the $55.00 the 30× row asks for in 2031.
And the moat is why the cycle is not the whole story: nobody else makes the machine. A pause delays the order; it does not send it elsewhere.
Multiplying a record quarter by four is the classic way to misprice a cyclical. The right base is earnings across a cycle, and your own table has one soft year in three. Choose the 20× row and the price needs 15.2% a year for five years, at a margin that has only been this high for one quarter.
And neither of us can see the one number that would settle it — the order book is not in this data. You are extrapolating the quarter; I am extrapolating 2024. Only one of us has a year of evidence that the extrapolation can fail.
Then judge it on the record neither of us can argue with: four beats in five reports, each of the last three larger than the one before — +8.42%, +8.77%, +19.31%. The estimates are falling further behind the business every quarter, and the share is up 67.82% in a year against 16.21% for SPY.
And on report days the share went down three times out of five, including after the biggest beat. The best two-session result in the table, +3.70%, followed the smallest beat, +0.79%, and a revenue miss. The reports are not what moves this price. Over the last 63 sessions it is down 7.56% against SPY's +2.51% — the market is not waiting for the estimates to catch up.
They agree on every figure. They disagree about one question: are these earnings the top of a cycle or the base of a new level? The bull says the moat and the acceleration make this cycle different; the bear says every cycle looks different at its peak, and 2024 is two years old. Neither has proof, because the evidence is the order book — which our data does not hold — and a series of quarterly revenue growth rates that has not been reported yet. That is why tab 1 nominates revenue growth as the number to watch, and why an investor who cannot say which side of that question they are on is holding a position in the cycle's mood rather than in the company.
What this method is for: to read a quarter as evidence rather than as news — what was expected, what arrived, and what the price did about the difference.
The headline below is the earnings calendar's, in dollars. The figures under the headline are the company's statements, in euros.
A large beat on earnings and a small miss on revenue — the largest EPS beat in the five reports our data covers, by $2.35 a share, on revenue $0.09bn short of the estimate. On the headline, an exceptional quarter with one blemish.
Revenue up 55.16% against the third quarter of 2025; net income up 133.49%; EPS of €12.93, up 135.95%; operating margin 44.36% against 34.60% for the whole of 2025. Underneath the beat was the best quarter in our data on every line, with one qualification the headline does not show: net income was 95.89% of operating income, against 85.03% for 2025, so part of the jump in net income came from below the operating line, and our data does not say which line. In dollars the same quarter grew less — revenue +49.42%, from $8.74bn to $13.05bn; EPS +126.52% — because the dollar figures imply fewer dollars per euro than a year earlier. And the market, which read all of it, took the share down 3.94% on 2.02 times its 30-day average volume.
| Reported | EPS estimate | EPS actual | EPS surprise | Revenue surprise | Close before | Close on the day | By the next close |
|---|---|---|---|---|---|---|---|
| 14 Oct 2026 | $12.17 | $14.52 | +19.31% | −0.69% | $1,717.76 | $1,650.00 (−3.94%) | not yet traded |
| 15 Jul 2026 | $7.98 | $8.68 | +8.77% | +4.16% | $1,775.64 | $1,815.27 (+2.23%) | $1,784.87 (+0.52%) |
| 15 Apr 2026 | $7.72 | $8.37 | +8.42% | +2.43% | $1,518.30 | $1,481.77 (−2.41%) | $1,410.83 (−7.08%) |
| 28 Jan 2026 | $9.04 | $8.55 | −5.42% | +3.77% | $1,454.59 | $1,422.92 (−2.18%) | $1,455.16 (+0.04%) |
| 15 Oct 2025 | $6.36 | $6.41 | +0.79% | −3.17% | $983.18 | $1,009.81 (+2.71%) | $1,019.59 (+3.70%) |
"Close on the day" is the close of the report-day session, and the market's first answer — the 14 October session traded 2.02 times its 30-day average volume. "By the next close" is cumulative from the close before the report.
The rest of the year says the same from the other side. The five largest one-day moves in our series — +9.53% on 11 June, +8.78% on 2 January, +8.77% on 8 April, −7.82% on 23 June and −7.36% on 1 July — all fell on days without a report. The price of this share is being set between the reports, by whatever the market believes about chipmakers' spending, and the reports are read against that belief rather than against the estimate.
The size of the surprises is worth reading as a sequence on its own: +0.79%, −5.42%, +8.42%, +8.77%, +19.31%. After the miss in January, each beat has been larger than the last — the estimates have fallen further behind the business every quarter. A company whose analysts cannot keep up is accelerating; a market that sells the largest beat in the table is no longer paying for the acceleration. Whether that is because it expects the acceleration to end, or because of something in the release our data does not carry, this page cannot tell.
Wednesday 27 January 2027. The fourth quarter and the full year. Estimates: EPS $15.56 (81.99% above the $8.55 of the same quarter a year earlier, and 7.16% above the third quarter's $14.52), revenue $16.10bn (38.71% above $11.61bn, and 23.34% above the third quarter). Based on the table above, the estimate is the least informative thing about it. What the market will be reading is whether the revenue growth rate is still rising, and what the order book says about the year after.
What this method is for: to put the other nine together and reach a decision — which, on this site, means reaching your decision. This page does not issue a verdict, and the next paragraph explains why that is a position rather than a dodge.
| Method | Its conclusion | Direction |
|---|---|---|
| 1 · Full analysis | Dollar EPS up 25.34% since July, share down 9.10%; the business is accelerating and the price is not following | Unresolved |
| 2 · Financials | Revenue up 22.54%, net income up 42.39%, margins at the top of the table — two years after a soft one | Positive |
| 3 · Moat | Sole supplier at the leading edge, 9/10 — it protects the share of spending, not the spending | Positive |
| 4 · Valuation | 41.1× in one currency; 30× needs 6.2% growth a year, 20× needs 15.2%, both at a record margin | Depends on the cycle |
| 5 · Risk | The cycle ranks first, and the two risks behind it cannot be sized from our data | Negative |
| 6 · Growth | Accelerating, from a flat year's base; the order book that would confirm it is missing | Positive |
| 7 · Institutional | Ownable at size, 51.61 points ahead of SPY over a year — and 10.07 behind over 63 sessions | Mixed |
| 8 · Bull vs bear | One disagreement: the top of a cycle or the base of a new level | Unresolved |
| 9 · Earnings | The largest beat produced the worst report day; surprise and reaction are unrelated | Negative |
Two numbers bound it, and both are on the chart. $1,614.02 is the 20-day low, with the $1,642.35 150-day average just above it — the band the share closed on, 2.23% above its floor — and the last line before the $1,571.41 200-day average. $1,873.50 is the 20-day high, reached in early October and lost on the slide into the report, and the last line before the $1,999.96 high of 30 June. Between them, the argument continues, with RSI(14) at 38.1 and MACD below its signal. The first scheduled test is the session after the report, untraded as this is written; the next is 27 January 2027.
It reduces to one question, and tab 8 established that both sides already agree it is the question: are today's earnings the top of a cycle or the base of a new level? If they are a base, the 30× row on tab 4 asks for less growth than the company is producing, and the multiple's fall since July is the market being slow. If they are a top, the reverse table is built on a margin that has existed for one quarter, and 2024 is what the next soft year looks like before the multiple is applied to it.
These are the four the nine panels above cannot answer for you, because the answers are about you rather than about the company:
What SigniBull is actually for. You can hold this position on paper here, at the market's own prices, with a trade log nobody can edit, and find out over the next four quarters whether your answer to the cycle question was right — before it is a decision about money. Open a free account and record it before the January report.