📐 The technical half
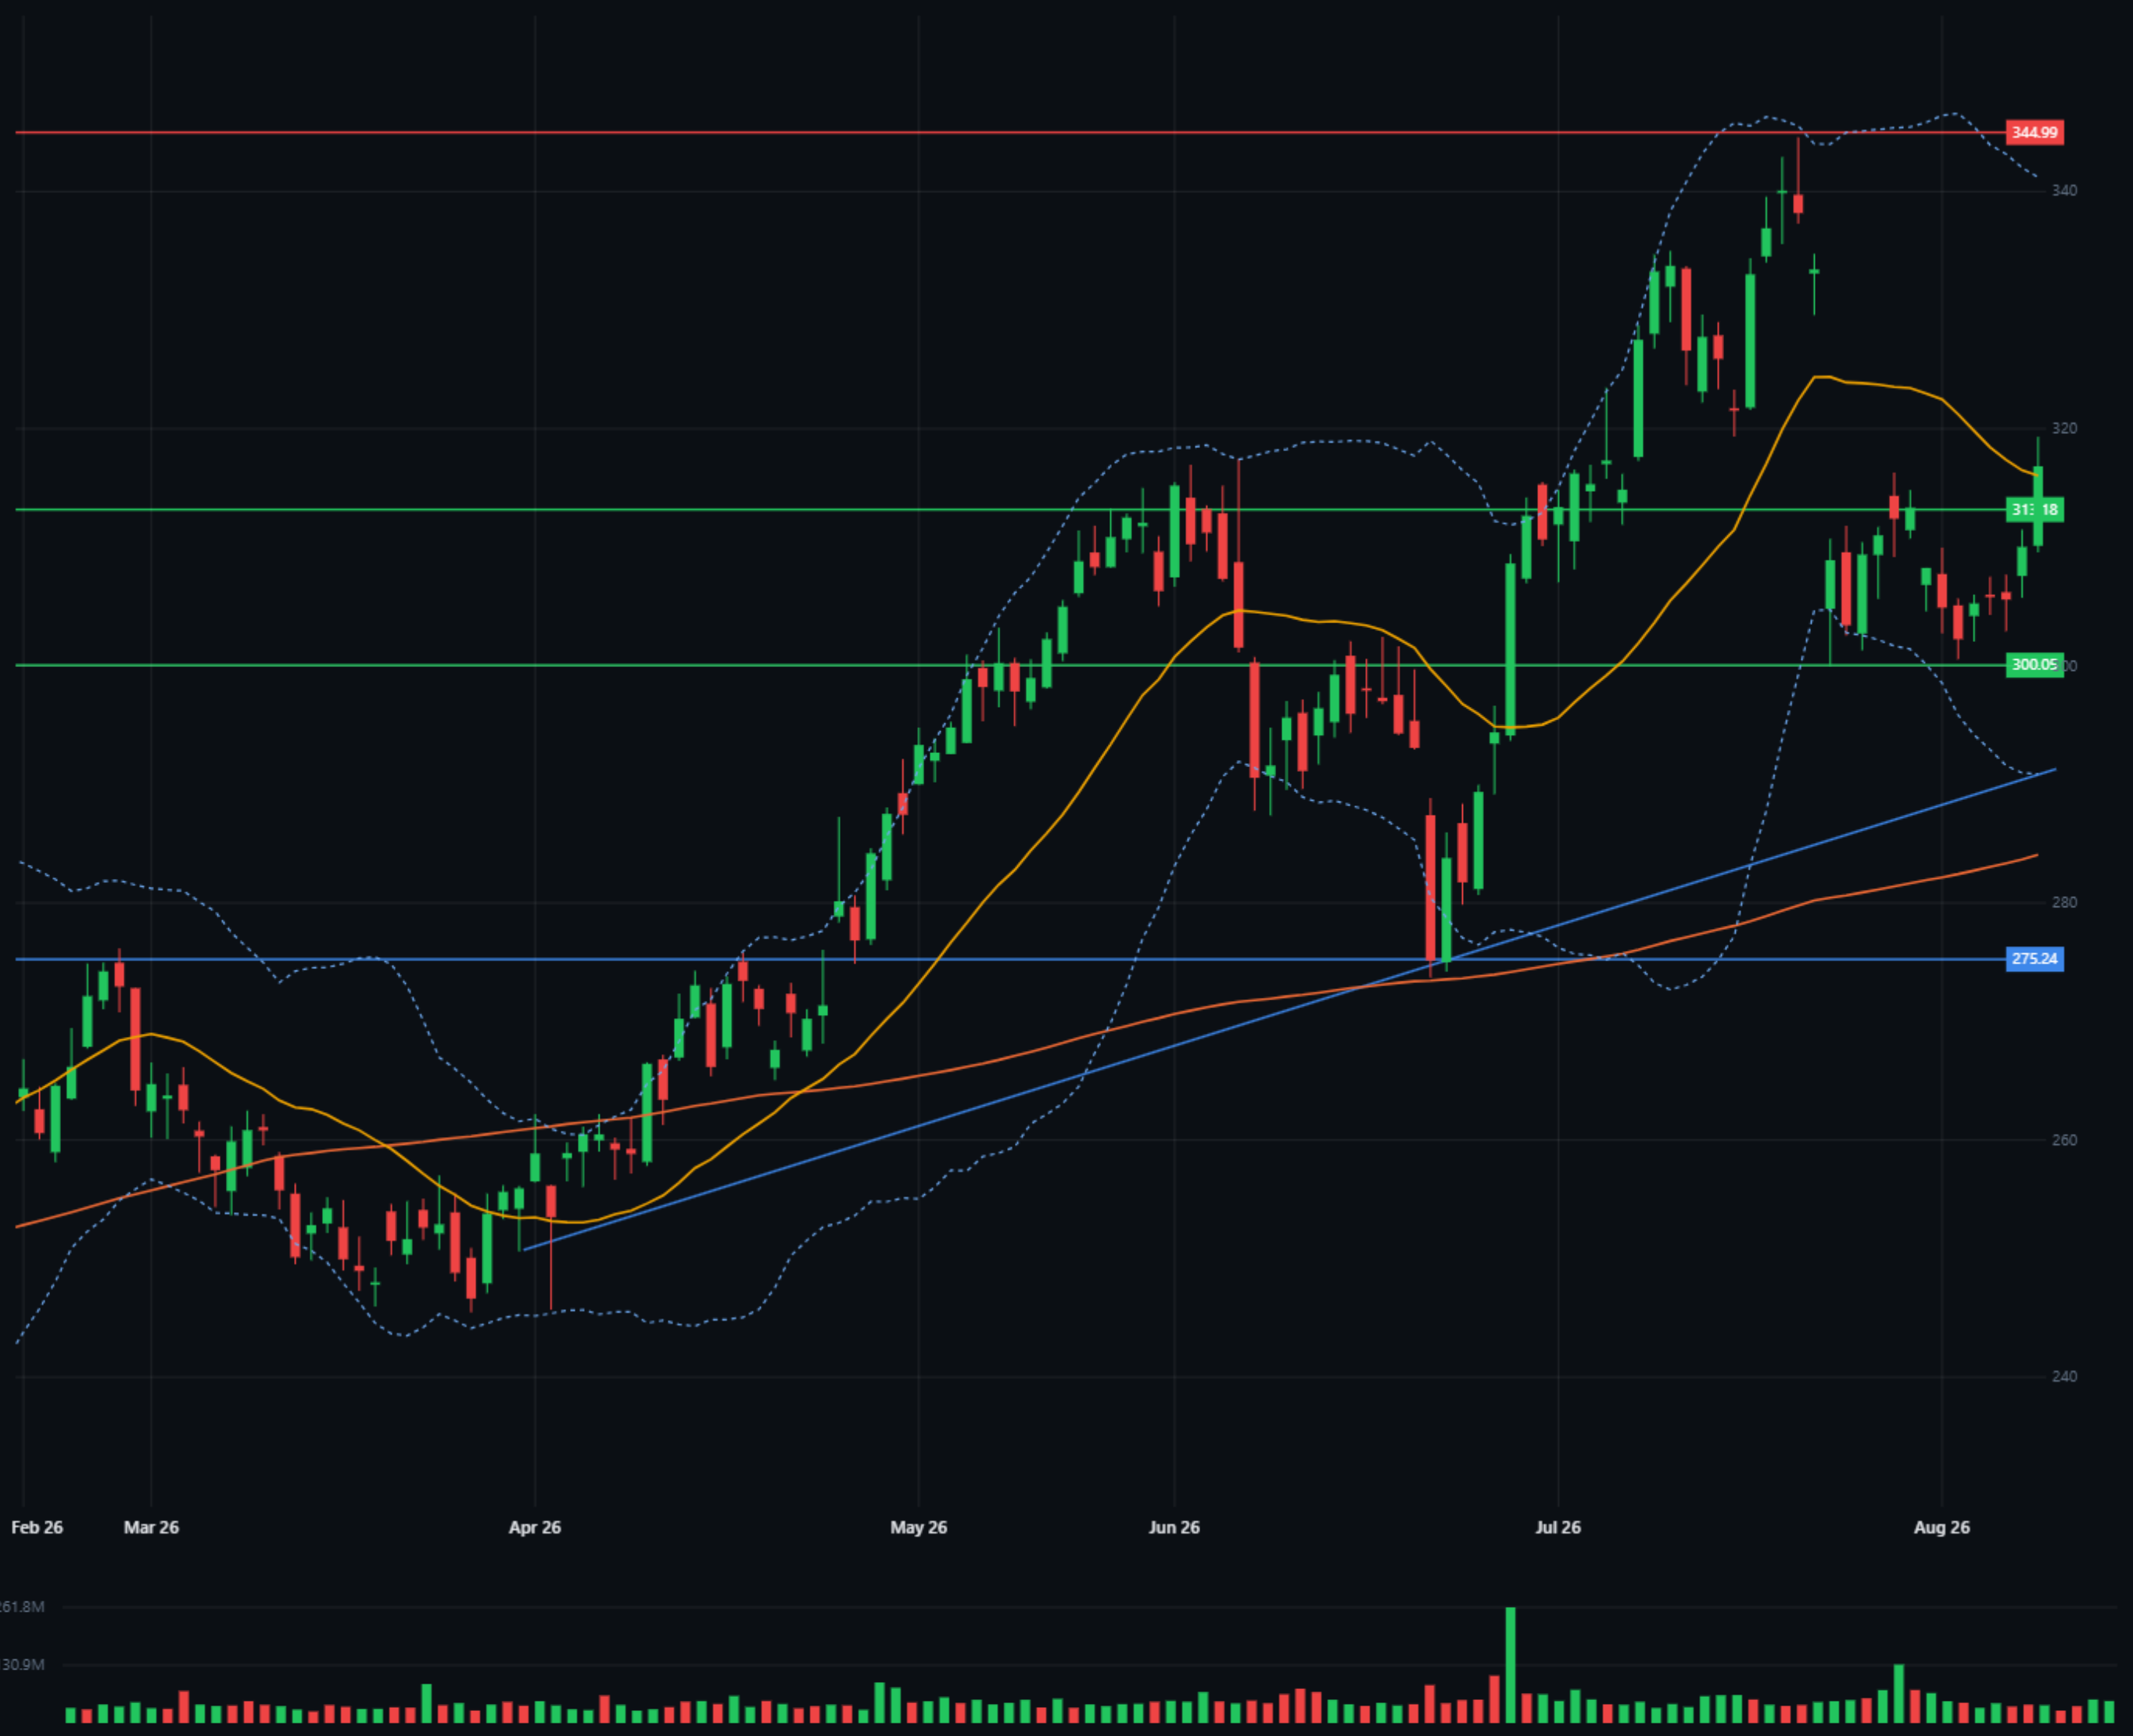
Support and resistance from prices the chart actually printed, drawn with our drawing tools; trend, moving averages and Bollinger Bands for context; volume as the confirmation filter. Two falsifiable scenarios — each with the trigger, the confirming volume, and what proves it wrong.
🏢 The fundamental half
What the business under the chart is doing: profitability and margins, valuation (P/E, EPS, market cap), the latest quarter against a year ago, and the risk profile (beta, sector). All from the platform’s Key stats — the same screen every member sees.
🎓 The teaching half
Every term explained in one line the first time it appears, stop-loss logic demonstrated with real risk-reward arithmetic — including the trades that fail the 1:2 bar — and an honest list of what the analysis does not cover.
The example: Apple, 20 August 2026
A complete analysis, free to read — the annotated chart in Full screen Graph mode, the level map, six months in four moves, volume, both scenarios, the stop arithmetic, and the fundamentals.
Read the full Apple analysis →
Five more, the latest on 23 September
Costco and ServiceNow analysed ten ways each, in the days before they reported; Oracle after a bounce on a third of the volume; and two companies whose revenue is growing while their profit shrinks — one priced at 9.78× earnings, the other at 323×. All free to read, and none of them a recommendation.
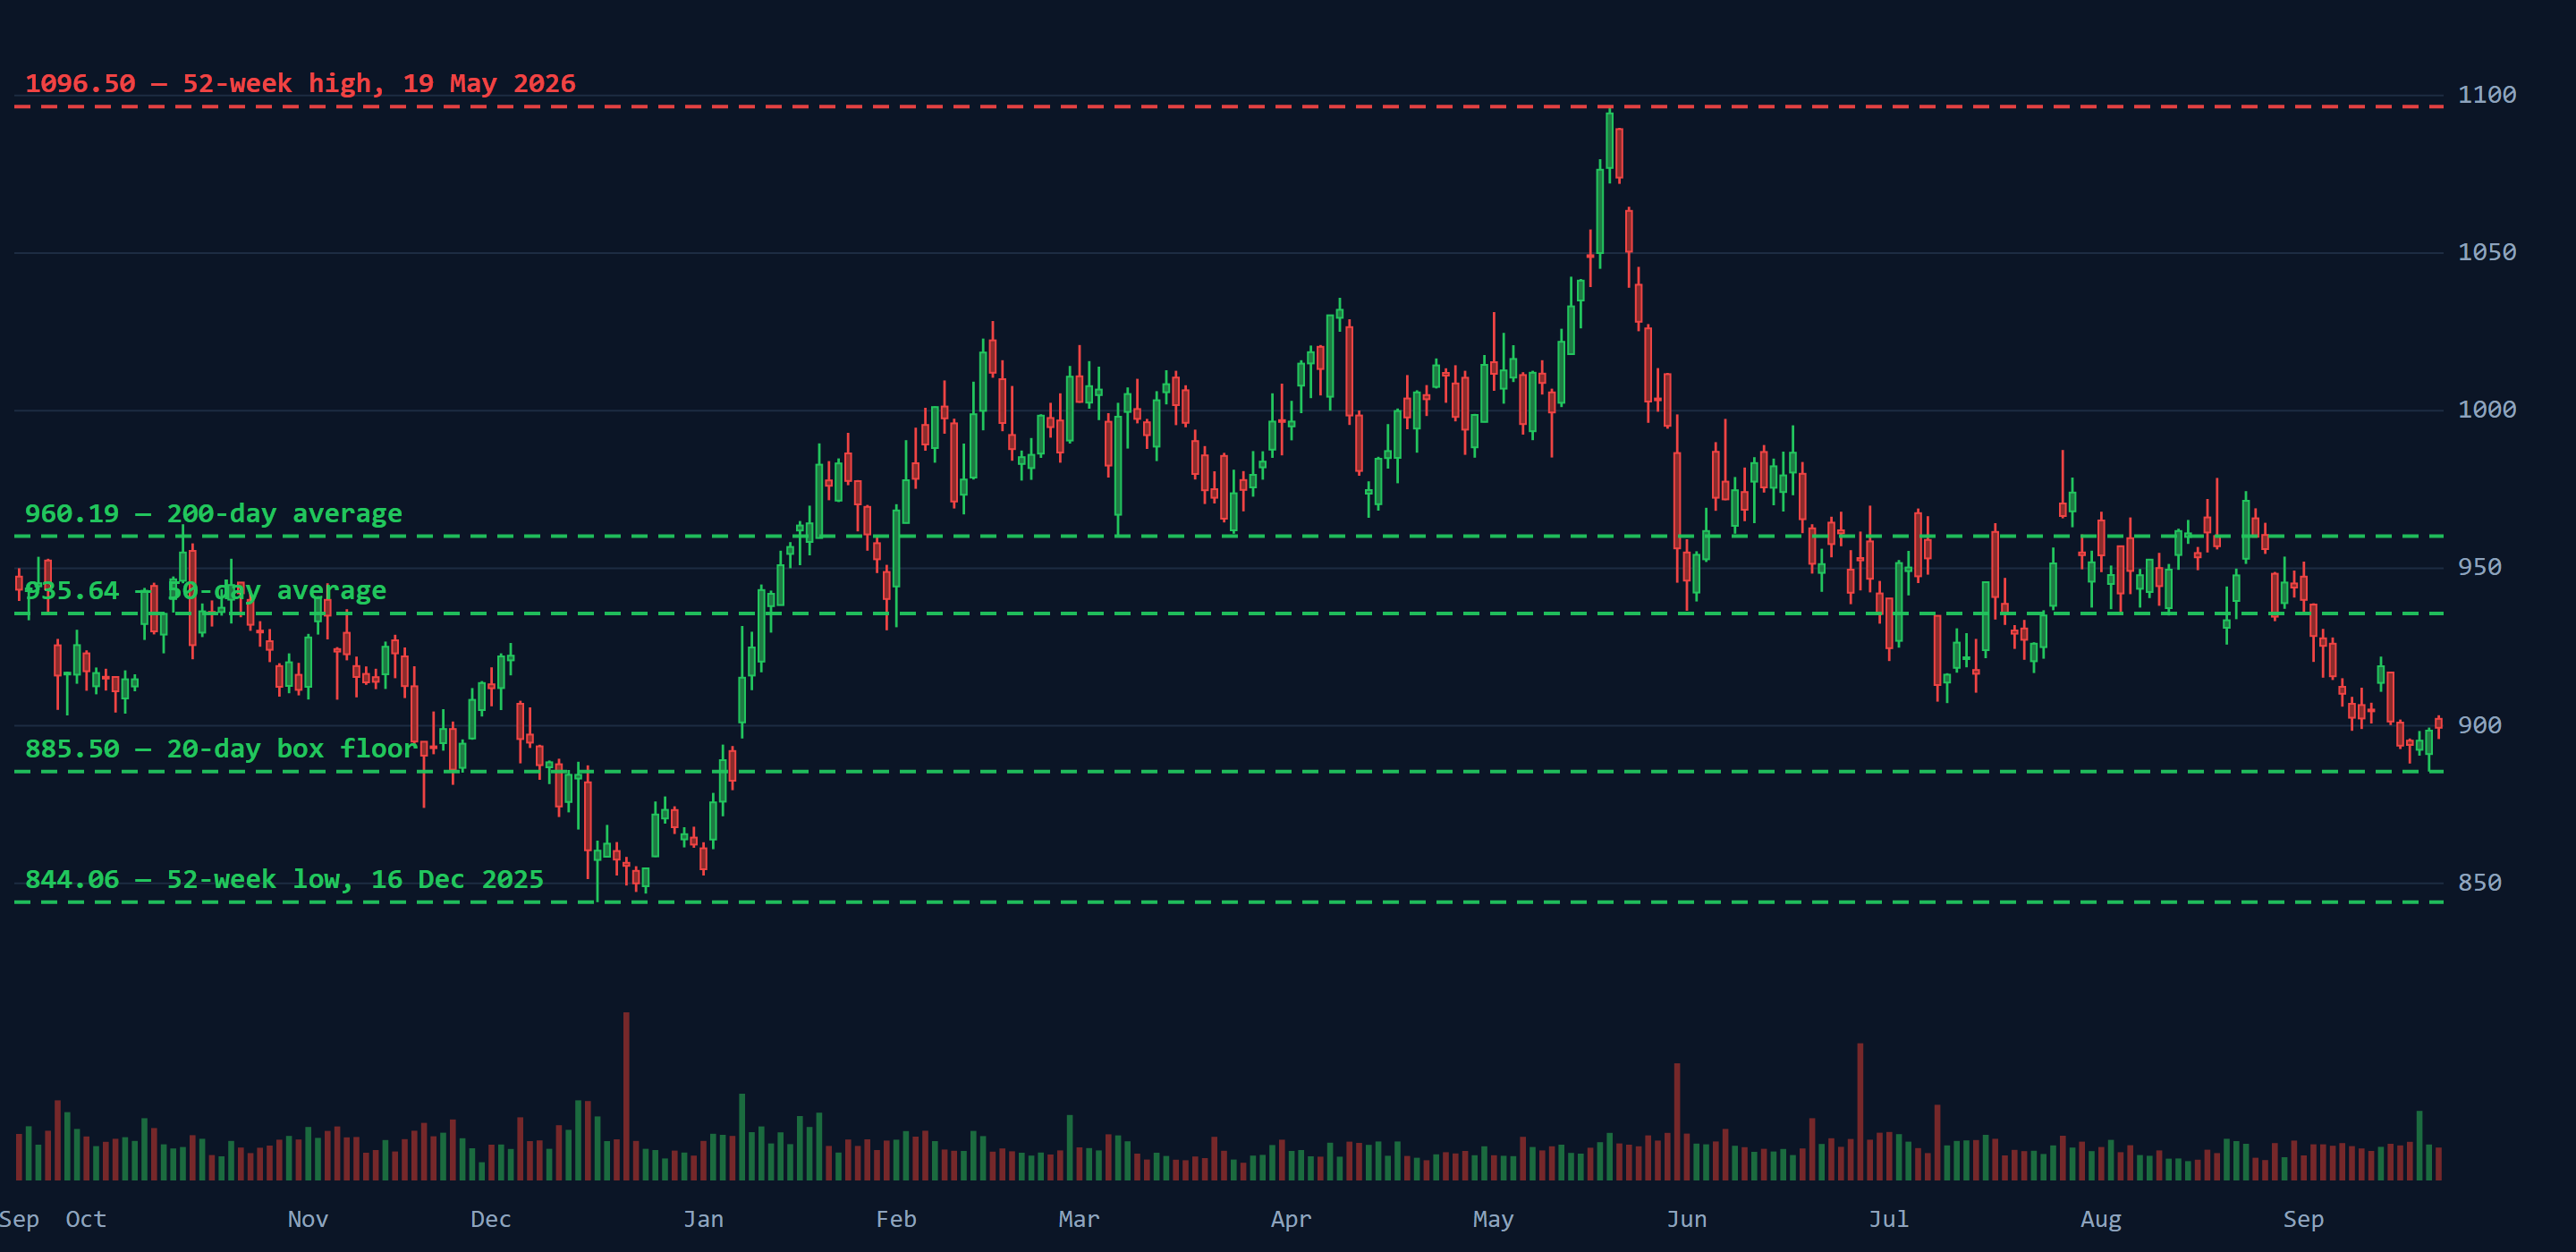
Costco — ten methods, the evening before its year-end report
Earnings per share up 12.76% in a year in which the share fell 4.65%: the multiple did all the work, from 53.5× to 45.2×. Ten methods on a retailer priced like a subscription, written on 23 September with the report due the next day — and the table showing what the price already assumes at 30× and at 20×.
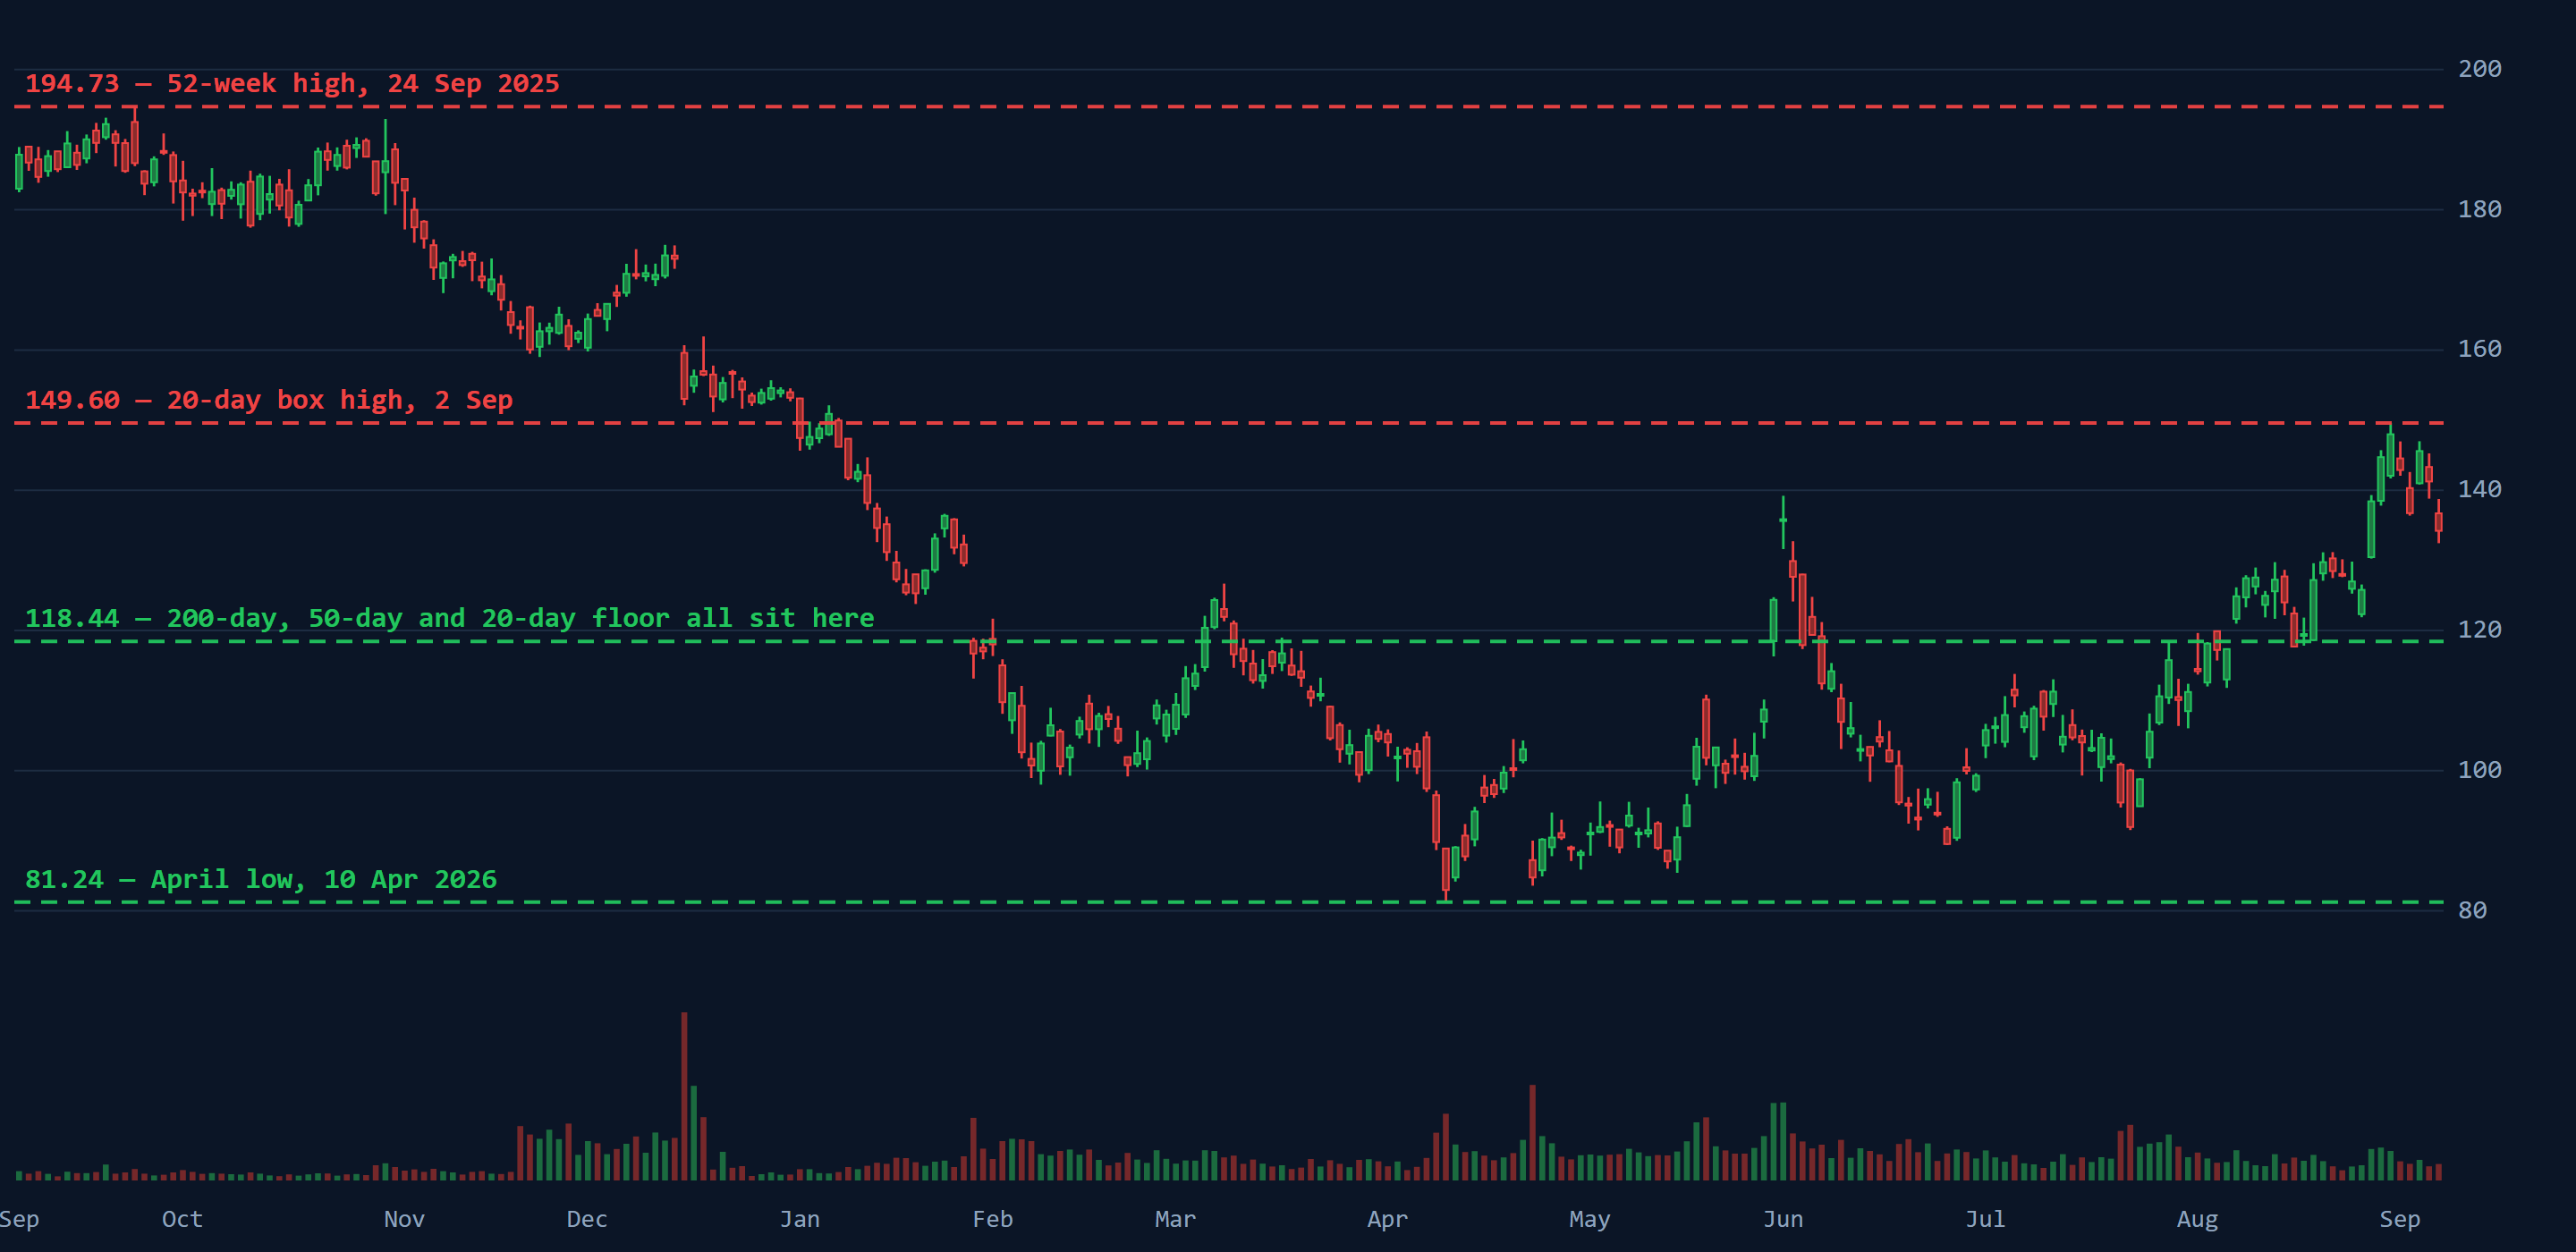
ServiceNow — ten methods, one company
The first analysis in the library written ten ways at once: financials, moat, valuation, risk, growth, the institutional view, a bull-bear debate and the last quarter, each in its own tab. Revenue up 22.19% while profit moved 0.54%, and five straight earnings beats, after four of which the share fell.
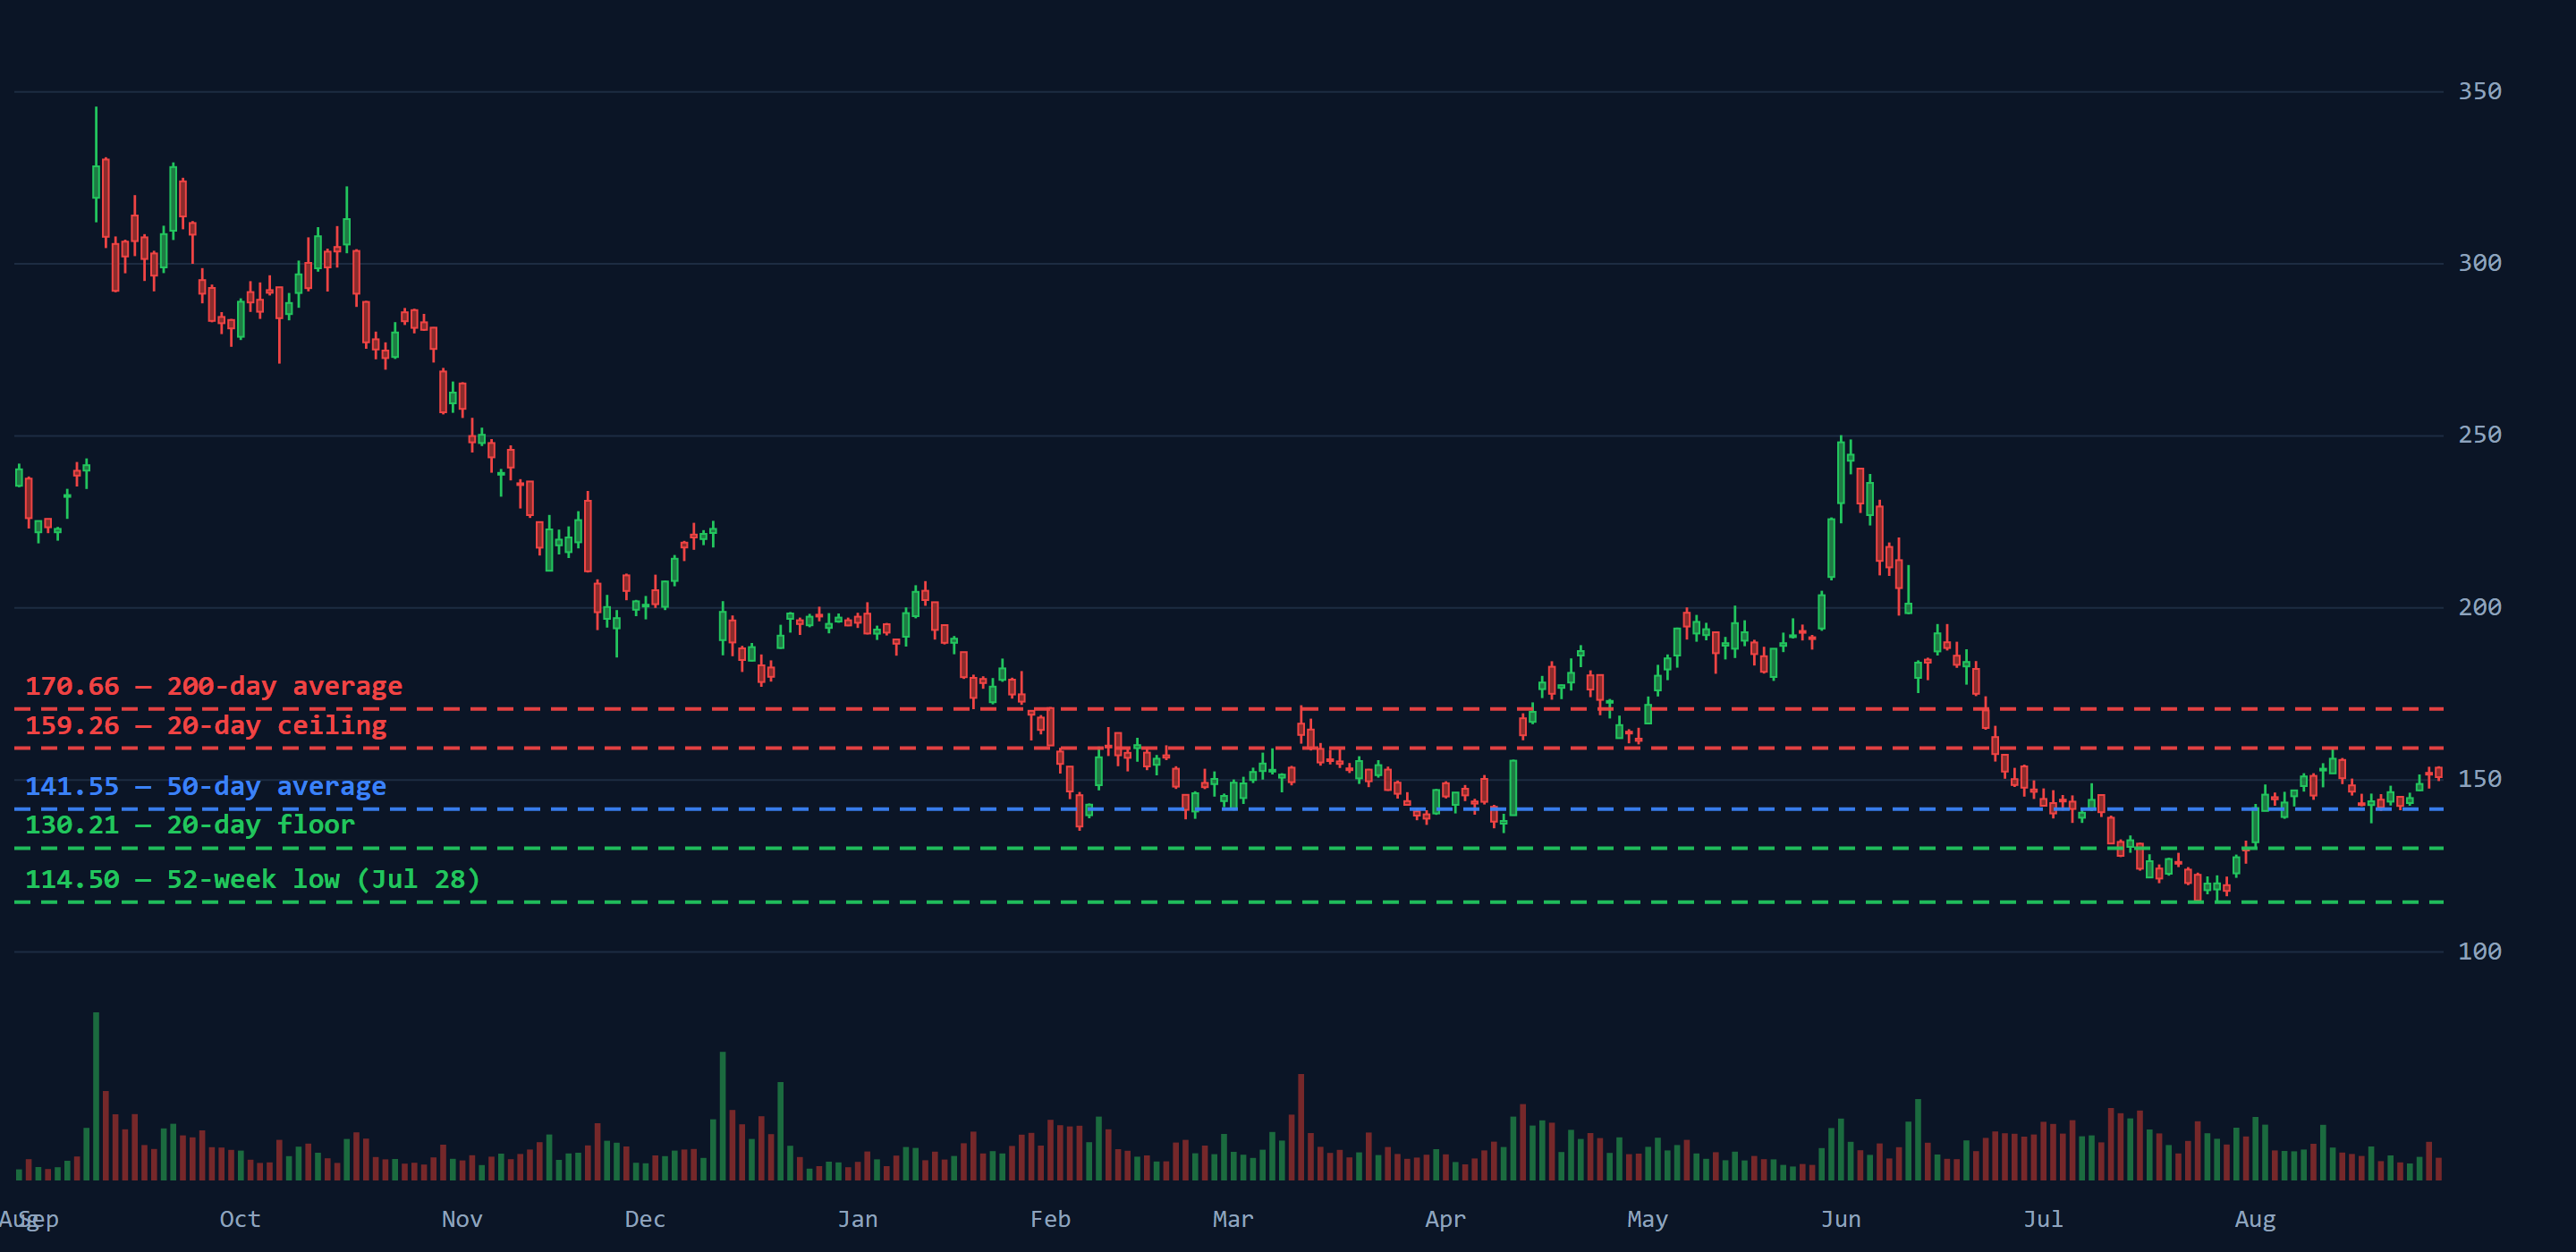
Oracle
56.37% below its high after a 31.75% bounce — on a third less volume than the fall. Revenue grew 17.35% and profit 37.32% while the multiple halved, and the last two earnings reactions both went the wrong way.
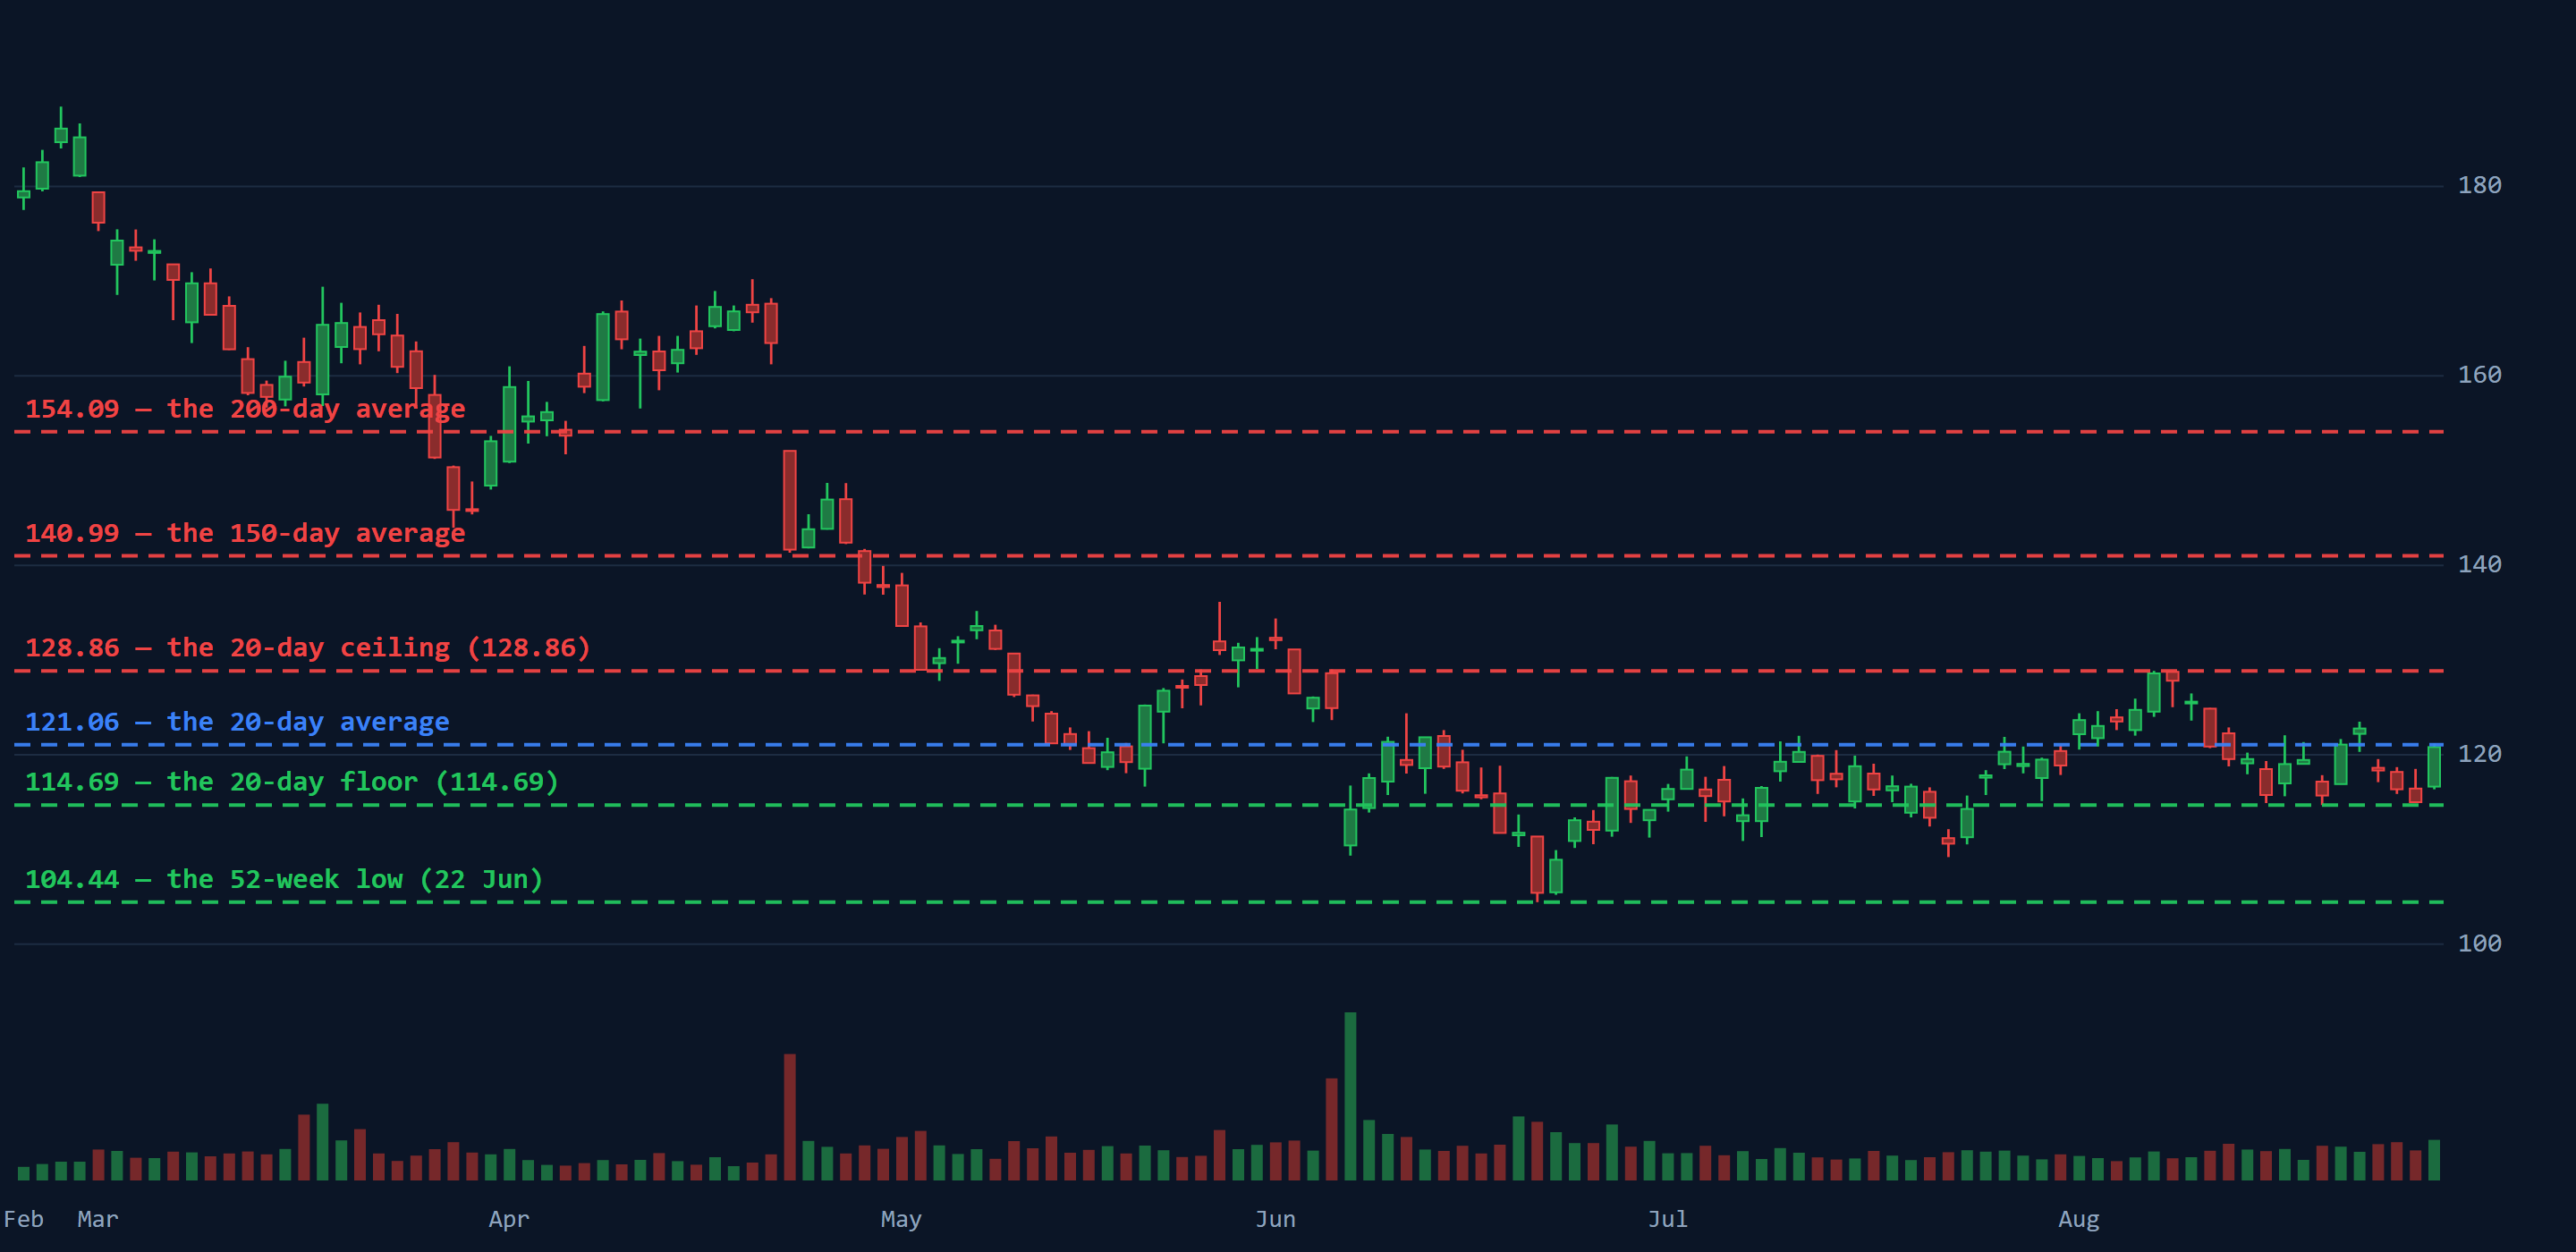
Lululemon
46.54% below its 52-week high at 9.78× earnings — a low multiple on a profit that fell 19.26% while revenue grew. Four straight consensus beats produced three lower opens, one of them a 19.87% gap.
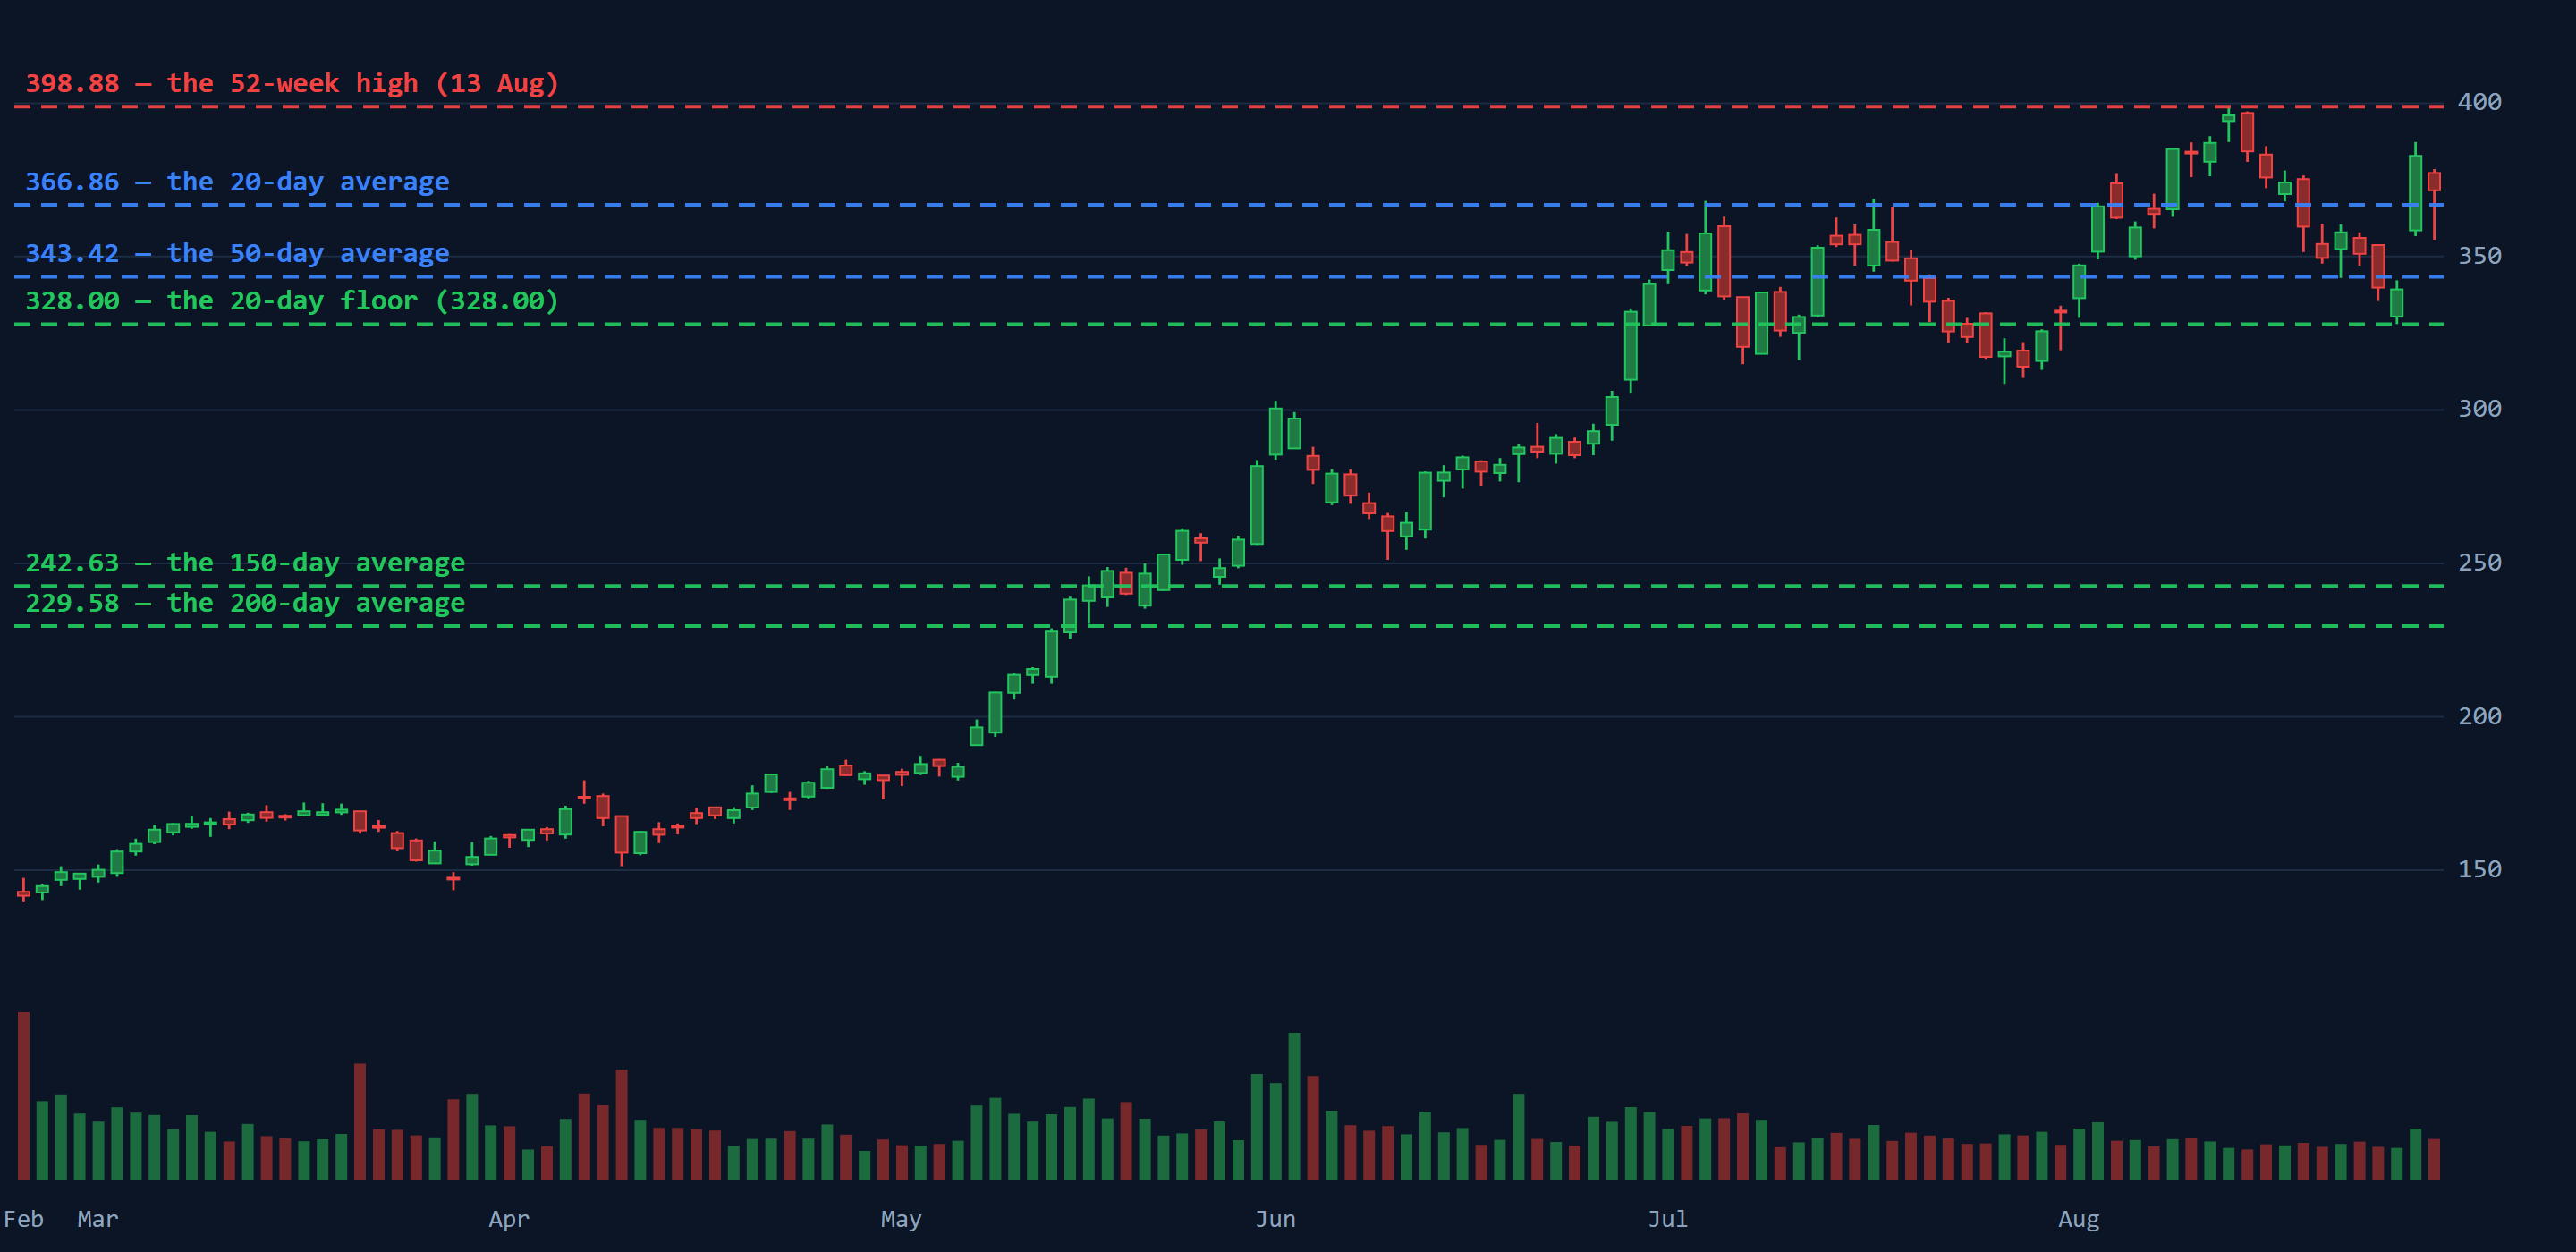
Palo Alto Networks
Up 148.72% in six months at 323× earnings. The last filed quarter grew revenue 31.15% and lost $177M — the same quarter the calendar records as a beat, and the reason the P/E reads as it does.
Members see every analysis first
These six are public. Members get the whole library — ten analyses and counting — in the Stock analysis tab, read inside the app alongside the live charts behind them, with every drawn level intact. Free, like everything else on SigniBull.
Join free — takes a minute