EPS (TTM)
$10.25
Citigroup is a bank that is paid to move money around the world. It is organised as five businesses: services, which runs cash management, payments and trade finance for companies that operate in many countries at once; markets, which trades and finances securities; banking, which advises companies and raises capital for them; wealth; and a US personal bank. For several years it has been working through a multi-year restructuring meant to simplify that structure, and a large part of the argument about the share is an argument about how that is going — which, as the boxes on this page say plainly, our data does not measure.
Three things follow, and every panel below is downstream of them. First, a bank's revenue is not a shop's: the interest it pays depositors and lenders is its cost of goods, so the top line that means something is revenue net of that interest — and our data switches between the two definitions, which tab 2 explains before it prints a single revenue figure. Second, the profit line has risen fast and unevenly: earnings per share of $4.04 in 2023, $5.95 in 2024, $6.99 in 2025 and $10.25 over the last twelve months, with one quarter in that run at $1.19. Third, the market has paid less for each dollar of those earnings as they rose — about 14.0 times a year ago, 11.93 times today — and the last two reports, both beats, were followed by the two worst reactions in the table on tab 9.
The share is $122.29, 22.49% above where it traded a year ago, ahead of SPY's 16.21% over the same 252 sessions, and 17.35% below its June high. It was 7.30% lower two sessions after the 13 October report — a report that beat the earnings estimate by 7.14%. Both of those facts are true, and the second is a good reason to read tab 9 before deciding what the first means.
What this method is for: to hold the whole company in view at once, so that no single strong number — a growth rate, a multiple, a chart — gets to decide the question by itself.
A bank earns the difference between what it is paid on loans and securities and what it pays for deposits and borrowing, plus fees for moving money, trading, advising and managing wealth. The meaningful top line is therefore net revenue — revenue after interest expense — and our earnings calendar carries it for five quarters: $22.09bn, $19.87bn, $24.63bn, $24.77bn and $23.85bn, the last for the third quarter of 2026 and 7.94% above the same quarter a year earlier. The four most recent quarters sum to $93.12bn. Our annual figures use a different, gross definition, which is why tab 2 opens with a box about it rather than a number.
Whatever moat exists is mostly in the services business: a company whose cash, payments and trade finance run through one bank's accounts in many countries does not move them lightly, and few banks have the network to take them on. That is a switching cost and a modest network effect, scored on tab 3. The rest of the bank — trading, advisory, consumer lending, wealth — competes with every other large bank on price, balance sheet and people, where moats are thin. The figure that would show whether the moat earns anything is return on tangible equity, and our data does not hold it.
Large banks are leveraged, regulated and cyclical. They earn more when rates and activity are high, they lose money when borrowers default, and the regulator decides how much capital they must hold — and therefore how much they can hand back to shareholders. The industry question of the moment for this company is narrower than the industry's: whether the restructuring changes what Citigroup earns on its capital enough for the market to pay more for it. The figures on this page show earnings rising fast. They cannot show the return on capital, because that is one of the numbers we lack.
Improving on every consistent line we hold. Net income was $9.23bn in 2023, $12.68bn in 2024, $14.31bn in 2025 and $19.33bn over the trailing twelve months; earnings per share $4.04, $5.95, $6.99 and $10.25. Net income was 20.76% of net revenue over the last four quarters. But "financial health" for a bank means capital and credit — whether it can absorb a bad year — and that is precisely the part this page cannot see. The year-by-year numbers are on tab 2.
A P/E of 11.93 on trailing earnings per share of $10.25. A year ago the share traded at about 14.0 times the prior twelve months' EPS of $7.12. We do not hold book value, so the multiple banks are normally priced on — price to tangible book — is not on this page, and tab 4 runs its reverse arithmetic on P/E alone. What it finds is that the price asks little of the growth rate and a great deal of the starting level: at 10 times earnings in five years, EPS needs to grow 3.59% a year from $10.25. The whole question is whether $10.25 is a base.
Earnings per share rose 43.96% in a year and the market cut the multiple from about 14.0 to 11.93 rather than pay for it. Three quarters running came in near $3 — $3.06, $3.15, $2.85 — and tab 4 shows that at 10 times in 2031 the price needs only 3.59% a year of EPS growth. On this reading the earnings have moved and the multiple has not caught up.
What has to be true: the 2026 quarters are the level, not the peak. The first test is the fourth quarter, reported on 14 January 2027, against the $1.19 of a year earlier.
The quarterly line has never been steady: $1.86, $1.19, $3.06, $3.15, $2.85, and the estimate for the next quarter is $2.30. A multiple on a trailing sum that contains one quarter at less than half the others describes an average, not a level. And the market has twice fallen on a beat: whatever it read in those releases, it was not reassured.
What has to be true: the 2026 earnings were a high point, and the lines the market reads underneath the headline — none of which this page holds — weaken before the headline does.
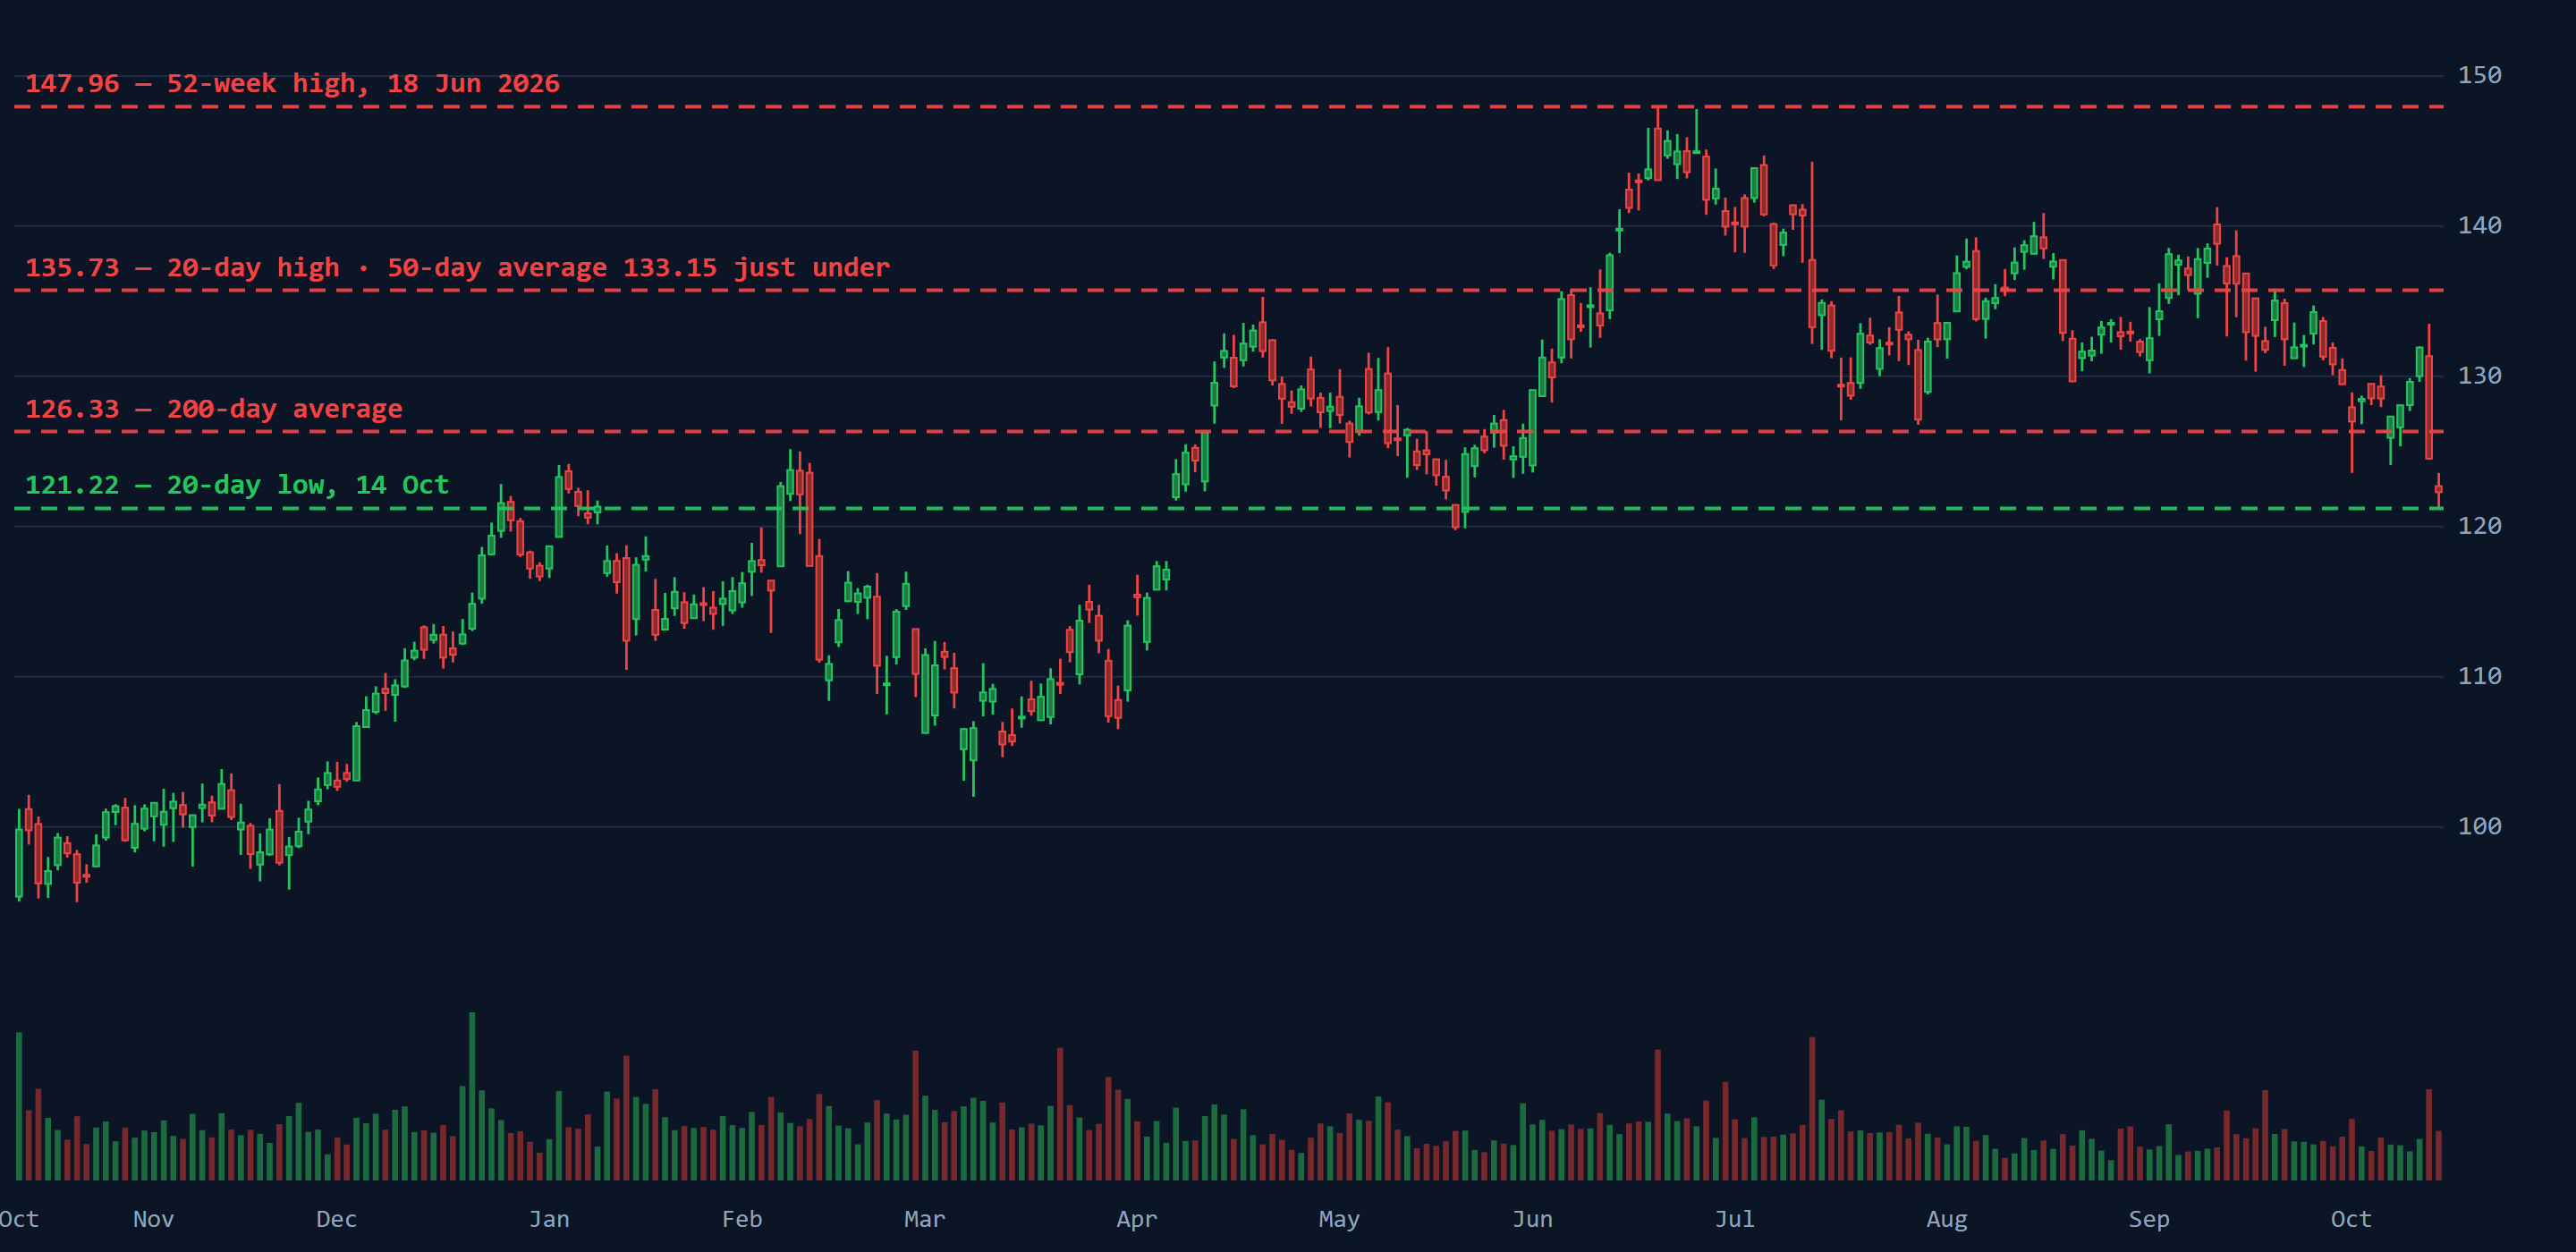
Neither case resolves in one report. Earnings stay near the 2026 level, the multiple stays near twelve, and the share trades on what each release says underneath its headline. The $121.22 low of the 20-day box and the $126.33 200-day average on the chart are the practical boundaries of that argument for now.
This page does not forecast a price. What it can say is which number will settle the argument, and it is quarterly earnings per share read against the same quarter a year earlier, because the disagreement on tabs 4 and 8 is about whether 2026's level holds. The next reading is 14 January 2027, the fourth quarter: EPS estimate $2.30 against $1.19 a year earlier, net revenue estimate $23.10bn against $19.87bn. Tab 9 adds the uncomfortable rider: on this share the number that settles the long argument has not been the number that moves the price on the day.
What this method is for: to see whether the company is getting stronger or weaker over years rather than quarters, by reading growth, margin and earnings as one sequence instead of three headlines.
| Period | Total revenue, gross* | Operating income | Net income | Net income growth | EPS | EPS growth |
|---|---|---|---|---|---|---|
| 2023 | $155.38bn | $12.91bn | $9.23bn | — | $4.04 | — |
| 2024 | $170.71bn | $17.05bn | $12.68bn | +37.43% | $5.95 | +47.28% |
| 2025 | $168.29bn | $19.83bn | $14.31bn | +12.81% | $6.99 | +17.48% |
| Prior TTM | not shown | — | $14.69bn | — | $7.12 | — |
| TTM to Q3 2026 | not shown | $26.66bn | $19.33bn | +31.59% | $10.25 | +43.96% |
* Total revenue as our provider reports it, including gross interest income. It is not the bank's net revenue and moves with interest rates as much as with the business; it is shown for completeness and no conclusion is drawn from it. The two twelve-month rows are left blank because they mix the gross and net definitions. TTM growth is against the prior twelve months; TTM EPS of $10.25 is the sum of the last four reported quarters, $1.19 + $3.06 + $3.15 + $2.85.
Gross margin and EBITDA are left out on purpose. For a bank, the interest it pays depositors and lenders is its cost of goods, so "gross profit" and "earnings before interest" do not describe anything; our provider computes both, and neither is a finding.
| Reported | Quarter | Net revenue estimate | Net revenue | Surprise | EPS estimate | EPS |
|---|---|---|---|---|---|---|
| 6 Nov 2025 | Q3 2025 | $21.09bn | $22.09bn | +4.76% | $1.73 | $1.86 |
| 21 Jan 2026 | Q4 2025 | $20.95bn | $19.87bn | −5.13% | $1.80 | $1.19 |
| 14 Apr 2026 | Q1 2026 | $23.60bn | $24.63bn | +4.38% | $2.65 | $3.06 |
| 14 Jul 2026 | Q2 2026 | $23.74bn | $24.77bn | +4.32% | $2.74 | $3.15 |
| 13 Oct 2026 | Q3 2026 | $23.74bn | $23.85bn | +0.46% | $2.66 | $2.85 |
Read as a sequence: $22.09bn, $19.87bn, $24.63bn, $24.77bn, $23.85bn. Only one year-on-year comparison exists on the same basis — the third quarter, up 7.94%. The fourth quarter of 2025 was the low point, 10.05% below the quarter before it, and the third quarter of 2026 was 3.72% below the second. So the honest description is a level and a shape rather than a growth rate: higher in 2026 than in 2025, and not rising within 2026.
Net income went from $9.23bn to $12.68bn (+37.43%) to $14.31bn (+12.81%), and to $19.33bn over the trailing twelve months, 31.59% above the twelve before. EPS went from $4.04 to $5.95 (+47.28%) to $6.99 (+17.48%) to $10.25 (+43.96%). From 2023 to 2025 that is 24.51% a year compounded for net income and 31.54% for EPS.
Two things in that sequence are worth saying out loud. EPS has grown faster than net income in every period, which is what a falling share count or smaller preferred dividends produce; we hold neither figure, so the page names the effect and not its cause. And earnings have grown far faster than net revenue: in the third quarter, net revenue rose 7.94% and EPS 53.23%. The difference was made below the revenue line — in expenses, credit costs, tax or the share count — and our data does not say which.
Net income as a share of net revenue — both on the same basis — was 20.76% over the last four quarters and 22.00% in the third quarter. This is not the net interest margin bank analysts quote; that needs interest-earning assets, which we do not hold. Nor can this ratio be computed for 2023 to 2025, because the annual revenue figures are gross. So this page has a margin level, not a margin trend.
The rule of 40 is a test for subscription software, which trades growth against margin at high gross margins; a bank's earnings turn on rates, credit and capital, and the test does not apply.
Strong on every line that is consistent, uneven on the quarter. Profit has compounded far faster than any revenue figure we hold, with one quarter in the run — $1.19 — that the annual totals smooth over. This method cannot say what produced the growth below the revenue line, and for a bank that is most of the question.
What this method is for: to ask why the company's profits should still exist in ten years, since anything profitable and unprotected gets competed away.
This is where the moat is. A multinational whose cash management, payments and trade finance run through one bank's accounts in many countries has connected its treasury, its suppliers and its approvals to that bank's plumbing, country by country. Moving it is a project measured in years, with the risk of payments failing in the middle. That is the same kind of lock that protects enterprise software. It does not extend to the rest of the bank: a trading client, a borrower or a card holder can take the next piece of business elsewhere at the cost of a phone call.
A payments network that reaches more countries, currencies and counterparties is more useful to each client on it, and a client paying suppliers in many countries values a bank that is already present in all of them. That is a real network effect, and it reinforces the switching cost above. It is moderate rather than strong because the network is not exclusive: payments travel between banks, and a client can use several.
Trust is what a bank sells, and a globally known name helps a corporate treasurer defend the choice. But a brand in banking commands no price premium on a loan or a trade, and the fact that the company has needed a multi-year restructuring is itself evidence that the name alone did not protect its returns.
Scale should lower a bank's funding cost and spread its technology and compliance spend. Whether it does here is measured by the cost of running the bank against its revenue, and we hold no expense figure. What we can say is that a company in the middle of a restructuring aimed at simplifying itself is one whose cost structure was part of the problem. Scored weak until a number says otherwise.
Banks build and buy similar systems, and nothing in banking technology is protected the way a drug or a chip design is. The technology question runs the other way: whether non-bank payment companies take the simpler pieces of what the services business does.
The competition is three groups. The other large global banks, which compete for the same multinational clients and the same trading flows, with comparable networks in some regions. Local banks in each country, which know their markets and lack the reach. And non-bank payment and technology firms, which compete on single products rather than on the whole relationship. Regulation is a barrier to entry for all of them — a new bank needs a licence and capital — but it protects every incumbent equally, so it is not a moat that sets this one apart.
Six. The services business has a genuine lock — a switching cost reinforced by a network — and that is rarer in banking than in most industries. The rest of the bank sells money, advice and risk-taking, which are close to commodities. What holds the score at six rather than seven is partly the evidence that is missing: a moat that works shows up as a return on equity above the cost of equity, and this page cannot see that number in either direction.
What this method is for: to separate the company from the price, because a good business bought at the wrong number is a bad investment and the two questions have different answers.
Twelve times earnings. A year ago the share was $99.84 and EPS over the prior twelve months $7.12 — about 14.0 times. Since then EPS rose to $10.25 and the share to $122.29. The multiple compressed by 14.91% in a year in which earnings per share rose 43.96%: the share went up, by about half as much as the earnings did. That is the tension the rest of this panel measures.
Rather than guess the future and discount it, hold the price still and solve for the growth that would justify it. The arithmetic: pick a multiple this company might trade at in five years, divide today's price by it to get the earnings per share that would be needed in 2031, and compare that with today's $10.25.
| If in 5 years it trades at | EPS needed | Against today's $10.25 | Implied EPS growth, per year |
|---|---|---|---|
| 14× earnings | $8.74 | −14.78% | −3.15% |
| 12× earnings | $10.19 | −0.58% | −0.12% |
| 10× earnings | $12.23 | +19.31% | +3.59% |
| 8× earnings | $15.29 | +49.13% | +8.32% |
| 6× earnings | $20.38 | +98.85% | +14.74% |
Why the table stops at earnings per share. On the earlier pages in this series it runs on from EPS to net income and from net income to the revenue needed. For a bank it cannot, honestly. The provider's net income divided by its share count does not reproduce the EPS the company reports — preferred dividends and a moving share count sit between the two, and we hold neither — and the revenue line changes definition inside our data (tab 2). Two more steps through numbers that do not reconcile would add precision and remove meaning.
How to read that table. It does not say the share is expensive or cheap. It says: for a buyer at $122.29 to get their money back with the share at 10 times earnings in 2031, EPS has to grow 3.59% a year from $10.25; if the market kept today's multiple, it would need no growth at all. The recent record sits far above every row — EPS compounded at 31.54% a year from 2023 to 2025 — but a rate measured from $4.04 flatters itself, and that is the easy half of the question. The hard half is the starting point. $10.25 is a sum of four quarters, one of which was $1.19 and three of which were near $3, and the estimate for the next quarter is $2.30. The table asks little of the rate and says nothing about the level, and the level is the whole argument.
One piece of arithmetic, which is not a forecast: if the January report met the $2.30 estimate exactly, it would replace the $1.19 in the trailing sum, trailing EPS would become $11.36, and today's price would be 10.76 times it. The multiple on this page moves by more than a full turn on one quarter's arithmetic — which is what an uneven earnings line does to a P/E.
The method asks for an industry-average multiple. Our data does not carry a peer set for this company, so any "large banks trade at so many times earnings" here would be a number I remembered rather than measured, and the whole value of the table above is that it contains none of those. A reader who wants the peer comparison can build it in the app: open the chart's Key stats tab for two or three comparable banks and read the P/E line from the same source for each.
What this method is for: to work out what would have to go wrong and how much it would cost, because the size of a loss matters more than its likelihood when the position is large.
Ranked most dangerous first among the risks our data can see. "Dangerous" here means the product of how likely it is and how much of the share price it would take, not how frightening it sounds. The largest risks a bank carries are listed after the ranking, because this page cannot rank them.
What this method is for: to ask where the next stretch of earnings would have to come from, and whether there is a plausible place for it to come from.
Three windows for earnings, all fast and all positive: 31.54% a year over two years, 43.96% over the last twelve months, 53.23% in the latest quarter. One window for revenue on a consistent basis: 7.94%. Earnings grew five to seven times faster than the only clean revenue figure we hold. Growth of that shape is made below the revenue line — lower costs, lower credit losses, fewer shares — and each of those has a floor that revenue does not. Costs can only be cut so far, credit losses cannot fall below zero, and a share count shrinks only as fast as the regulator lets capital go.
Tab 4 computed what the price assumes; this is the same figure read as an operating question. At 10 times earnings in 2031 the price needs EPS of $12.23, a rate of 3.59% a year from $10.25; at 8 times it needs $15.29, or 8.32% a year. EPS went from $4.04 in 2023 to $10.25 over the last twelve months. Measured as a rate, then, the price asks for a fraction of what the company has recently done. Measured as a level, it asks something harder: whether $10.25 is a floor that growth compounds from, or a high point that the next weak quarter revises. The growth case for this company rests on the earnings holding, not accelerating — a smaller claim than most growth cases make, and a harder one to check from outside a bank's balance sheet.
What this method is for: to look at the share the way the people who move it do, since a private investor is trading against institutions and it helps to know what they are solving for.
A fund manager is not answering "is this a good company". They are answering "does this position help the portfolio I have to report on", and those are different questions with different answers.
A global bank whose earnings per share rose 43.96% in a year, trading at 11.93 times after the market cut the multiple from about 14, and marked down after both of its last two beats. The position is a bet that the 2026 earnings are a level and not a peak; the evidence is quarterly EPS against the year-earlier quarter, next read on 14 January 2027. Sized for the reaction, not for the headline.
What this method is for: to force the strongest version of the argument you disagree with, because the case you cannot state is the one that costs you money.
Both analysts below are arguing from the same figures on this page. That is the exercise: identical data, opposite conclusions, and the reader watching where the disagreement actually is.
Start with the only sequence on this page with no bad year in it: earnings per share of $4.04, $5.95, $6.99, and $10.25 over the last twelve months. Net income from $9.23bn to $19.33bn. The quarter just reported was 53.23% above the same quarter a year ago.
And the market paid less for it. The multiple went from about 14.0 to 11.93; the share rose 22.49% while earnings per share rose 43.96%. The earnings have moved and the price has not caught up. That is the setup, not the warning.
Read the quarters instead of the years: $1.86, $1.19, $3.06, $3.15, $2.85, and the next estimate is $2.30. Your $10.25 contains a quarter at less than half the others, and the latest quarter is already below the best one.
And watch what the market does with your beats. It fell 7.30% on a 7.14% beat and 4.14% on a 14.96% beat. Twice in a row, people who can read the whole release decided the headline was not the news.
Take the level argument to the table on tab 4. At 10 times earnings in 2031 the buyer today needs 3.59% a year of EPS growth; at today's multiple, none. You do not need the best quarter to repeat — you need the average to hold.
And the market looks through single quarters in both directions: it rose 2.54% after a 33.89% miss in January. A share that shrugs off a miss is not a share that has lost faith in the earnings.
Then it looks through the beats too, and since June it has looked through them downward: 17.35% off the high. Your 3.59% assumes $10.25 is the base. In the third quarter net revenue grew 7.94% and EPS 53.23%; growth made below the revenue line has an end that revenue growth does not.
And neither of us can see what made it. Credit costs, expenses, capital — none of it is on this page. You are defending a number whose ingredients you have not read.
Neither have you — which is why I would rather stand on the year than the month. Over 252 sessions the share is up 22.49% against SPY's 16.21% and 28.73% above its October 2025 low. A fall from a June high inside a year of outperformance is a pullback, and a pullback at twelve times earnings is not where long arguments end.
The year is two half-years. Over the last 126 sessions it fell 7.14% while SPY rose 9.95%. It is below every average on the chart, RSI(14) is 33.1, and on the day after its report it closed 0.88% above a 20-day low it set that same day. The outperformance you are standing on belongs to the first half of the year. The second half belongs to me.
They agree on every figure. They disagree about one question: are Citigroup's 2026 earnings a level or a peak? The bull reads three quarters near $3 as the new base and the multiple as the thing that has not caught up; the bear reads the $1.19 and the $2.30 estimate as proof the line is not a level, and the two falls after two beats as the market saying so. Underneath that sits a second disagreement neither can settle from this page: what the market is reading in the release that the headline does not show. Both are arguing about the ingredients of earnings — credit, costs, capital — that our data does not carry. That is why tab 1 nominates the quarterly EPS line as the number to watch, and why an investor who cannot say which of those quarters is the normal one is holding a position in the market's mood rather than in the company.
What this method is for: to read a quarter as evidence rather than as news — what was expected, what arrived, and what the price did about the difference.
A beat on both lines: earnings by 7.14%, net revenue by 0.46%, and net revenue up 7.94% on the same quarter a year earlier. On the headline, a good quarter.
Against the same quarter a year earlier, everything rose: net income 39.79%, earnings per share 53.23%, net revenue 7.94%. Against the quarter before, everything fell: EPS from $3.15 to $2.85, net revenue from $24.77bn to $23.85bn. And the revenue beat, +0.46%, was the narrowest of the four beats in the table. Those are the facts our data holds alongside the reaction. It does not hold the lines underneath them, and it cannot say which of them the market read. What the market did is not in doubt: the share fell 5.60% on the day, on 2.07 times average volume — the largest one-day fall of the year in our series — and another 1.80% the next.
| Reported | EPS estimate | EPS actual | Surprise | Close before | Close on the day | By the next close |
|---|---|---|---|---|---|---|
| 13 Oct 2026 | $2.66 | $2.85 | +7.14% | $131.92 | $124.53 (−5.60%) | $122.29 (−7.30%) |
| 14 Jul 2026 | $2.74 | $3.15 | +14.96% | $140.71 | $133.27 (−5.29%) | $134.89 (−4.14%) |
| 14 Apr 2026 | $2.65 | $3.06 | +15.47% | $126.28 | $129.58 (+2.61%) | $131.69 (+4.28%) |
| 21 Jan 2026 | $1.80 | $1.19 | −33.89% | $112.80 | $113.86 (+0.94%) | $115.66 (+2.54%) |
| 6 Nov 2025* | $1.73 | $1.86 | +7.51% | $101.69 | $100.85 (−0.83%) | $100.79 (−0.89%) |
"By the next close" is cumulative from the close before the report. Our data does not carry the time of day of a release, so the table shows both the report-day close and the next one rather than choosing; on this share the large moves have come on the report day itself. * The 6 November 2025 row is measured from the date our data provider records for that report, and the table asserts no other date for it.
The surprises are worth reading as sequences on their own. Earnings per share, oldest first: +7.51%, −33.89%, +15.47%, +14.96%, +7.14%. Net revenue: +4.76%, −5.13%, +4.38%, +4.32%, +0.46%. The one miss was a miss on both lines, and it rose; the latest earnings beat was the smallest of the four in the table and its revenue beat the narrowest, and it fell the most. Neither sequence lines up with the reactions — which is the point.
The fourth quarter of 2026. Estimates: EPS $2.30, which is 93.28% above the $1.19 of the same quarter last year and 19.30% below the $2.85 just reported; net revenue $23.10bn, 16.26% above last year's $19.87bn and 3.11% below this quarter's $23.85bn. The fourth quarter of 2025 was the weakest in our table on both lines, and the estimate for this one again sits below the quarter before it. One year of history is one observation, not a seasonal pattern, and our data does not say why that quarter was so low — a weak quarter and a one-off charge look the same in a headline EPS figure. On the evidence of the table above, the estimate has been the least informative thing about this company's reports.
What this method is for: to put the other nine together and reach a decision — which, on this site, means reaching your decision. This page does not issue a verdict, and the next paragraph explains why that is a position rather than a dodge.
| Method | Its conclusion | Direction |
|---|---|---|
| 1 · Full analysis | EPS up 43.96%, share up 22.49%, multiple from about 14.0 to 11.93 — and the last two beats fell | Unresolved |
| 2 · Financials | Profit compounding far faster than net revenue, with one quarter at $1.19 in the run | Positive |
| 3 · Moat | A real lock in services, close to commodity elsewhere; 6/10 with the return figure missing | Mixed |
| 4 · Valuation | At 10× in 2031 the price needs 3.59% a year; it doubts the level, not the rate | Depends on the level |
| 5 · Risk | The reaction is the risk firing; credit and capital cannot be ranked from our data | Negative |
| 6 · Growth | Earnings five to seven times faster than net revenue, made below the revenue line | Mixed |
| 7 · Institutional | Ownable at size and ahead of SPY over a year — behind it on every shorter window | Mixed |
| 8 · Bull vs bear | One disagreement: are the 2026 earnings a level or a peak? | Unresolved |
| 9 · Earnings | Two beats, two falls, a miss that rose — the surprise has not predicted the direction | Negative |
Two numbers bound it, and both are on the chart. $121.22 is the 20-day low, set intraday on 14 October and 0.88% under the close — the last drawn line beneath the price. $126.33 is the 200-day average, 3.30% above the close, which the price closed below on the day of the report and would have to regain for the chart to say anything other than "down". Above that sits the $133.15 50-day average with the $135.73 20-day high just over it. Between the first two lines, the argument continues. The next scheduled event that could resolve it is 14 January 2027, and the table on tab 9 says the size of the beat will not be what decides the two sessions after it.
It reduces to one question, and tab 8 established that both sides already agree it is the question: are Citigroup's 2026 earnings a level or a peak? If they are a level, the share needs 3.59% a year of EPS growth to stand at today's price at 10 times earnings in 2031, the multiple's fall from about 14 was the market being slow, and the bull's reading of the last two reactions holds. If they are a peak, the $10.25 on which every multiple on this page is computed was a high-water mark, and 11.93 times a high-water mark is a different number from what it appears to be.
These are the four the nine panels above cannot answer for you, because the answers are about you rather than about the company:
What SigniBull is actually for. You can hold this position on paper here, at the market's own prices, with a trade log nobody can edit, and find out over the next four quarters whether your answer to the level question was right — before it is a decision about money. Open a free account and record it before the January report.