TTM revenue
$293.59bn
Costco sells membership, and uses the warehouses to justify it. A household pays an annual fee for the right to shop in a building with a deliberately short list of products, sold in large sizes at a markup the company caps by policy. The goods are priced close to cost; the fee is where the profit lives. That one arrangement explains a gross margin of 12.88% that would be a disaster for any other retailer and is the entire point of this one.
Three things follow from that description, and every panel below is downstream of them. First, revenue is enormous and profit is thin — $293.59bn of sales over the last twelve months produced $8.84bn of net income, three cents on the dollar — so a small change in margin is a large change in earnings. Second, the customer renews a fee rather than merely returning, which is the origin of whatever moat exists and the reason the earnings line is steadier than the sales line. Third, the market prices the company like a subscription business, at 45.24 times earnings, and not like a grocer — which is the argument the valuation panel and the risk panel are having with each other.
The share is $899.41, 4.65% below where it traded a year ago and 17.97% below its May high, over a year in which earnings per share rose 12.76%. Both of those numbers are true and they describe the same fact from two sides: the multiple did all the work. The company reports its year-end quarter tomorrow, 24 September, which is a good reason to read tab 9 before deciding anything.
What this method is for: to hold the whole company in view at once, so that no single strong number — a growth rate, a multiple, a chart — gets to decide the question by itself.
Merchandise sales are the revenue; membership fees are the profit. Our data holds the first as one line — trailing twelve-month revenue of $293.59bn against $268.78bn in the prior twelve months, +9.23% — and does not separate the second, which is the first thing a reader should know about every margin figure on this page (see the box below). What the figures do show is the shape: gross margin 12.88%, operating margin 3.82%, net margin 3.01%. A supermarket with those margins would be ordinary. A company that chooses them, and grows net income 12.69% on them, is doing something else.
The moat is cost, and the cost advantage is a decision rather than an accident: a short product list bought in volume, a capped markup, a warehouse instead of a shop, and a fee that pays for the building. Scored on tab 3. The membership is what turns a cost advantage into a habit — a household that has paid for the year shops there to justify the fee — and the renewal is what makes the earnings line steadier than the sales line. It is also the moat's limit: a member who does not renew is gone at once, which is why the renewal rate is the figure the market watches and the one our data does not hold.
Discount retail is a scale business in which the largest buyer gets the lowest price and passes some of it on, so the advantage compounds with size. The industry argument of the moment is whether online delivery breaks that — whether a household that can have anything brought to the door still drives to a warehouse for a pallet of paper towels. The figures on this page say it has not happened yet: the most recent quarter grew 11.58%, faster than the year. What they cannot say is whether the multiple already assumes it never will.
Improving on every line we hold. Operating margin over the trailing twelve months is 3.82%, against 3.77% for financial 2025, 3.65% for 2024 and 3.35% for 2023. Gross margin has risen each year, from 12.26% to 12.88%. Net margin from 2.60% to 3.01%. Small numbers, moving the right way for three years — and in a business earning three cents on the dollar, four tenths of a point of net margin is a seventh of the profit. The numbers, year by year, are on tab 2.
Our data carries a price-to-sales ratio of 1.36 and a P/E of 45.24. We do not hold a peer set, so this page does not print a "retail trades at 25×" it cannot source. What tab 4 does instead is turn the question around: given the price, what growth is already assumed? That arithmetic uses only figures we hold and every step of it is shown — and the answer, for once, is not a demanding one.
The multiple has already reset from 53.5 to 45.2 while earnings compounded at 13.4% a year, and tab 4 shows the price now needs revenue growth of about 8.6% — roughly what the company delivers — to justify 30× in five years. Margin keeps creeping up, the share grows into a number it has already fallen toward.
What has to be true: revenue growth stays near or above 9% and net margin holds 3%. Both are reported tomorrow.
Forty-five times earnings is still a growth multiple on a grocer whose two-year compound revenue growth is 6.58%. The last report was the first estimate miss in the series and the share fell 3.91% on triple volume. The multiple has further to travel toward what a 3%-margin retailer usually gets, and nothing the company reports can stop a re-rating.
What has to be true: revenue growth drifts back toward the two-year rate while the multiple keeps compressing — the pattern of the last four months.
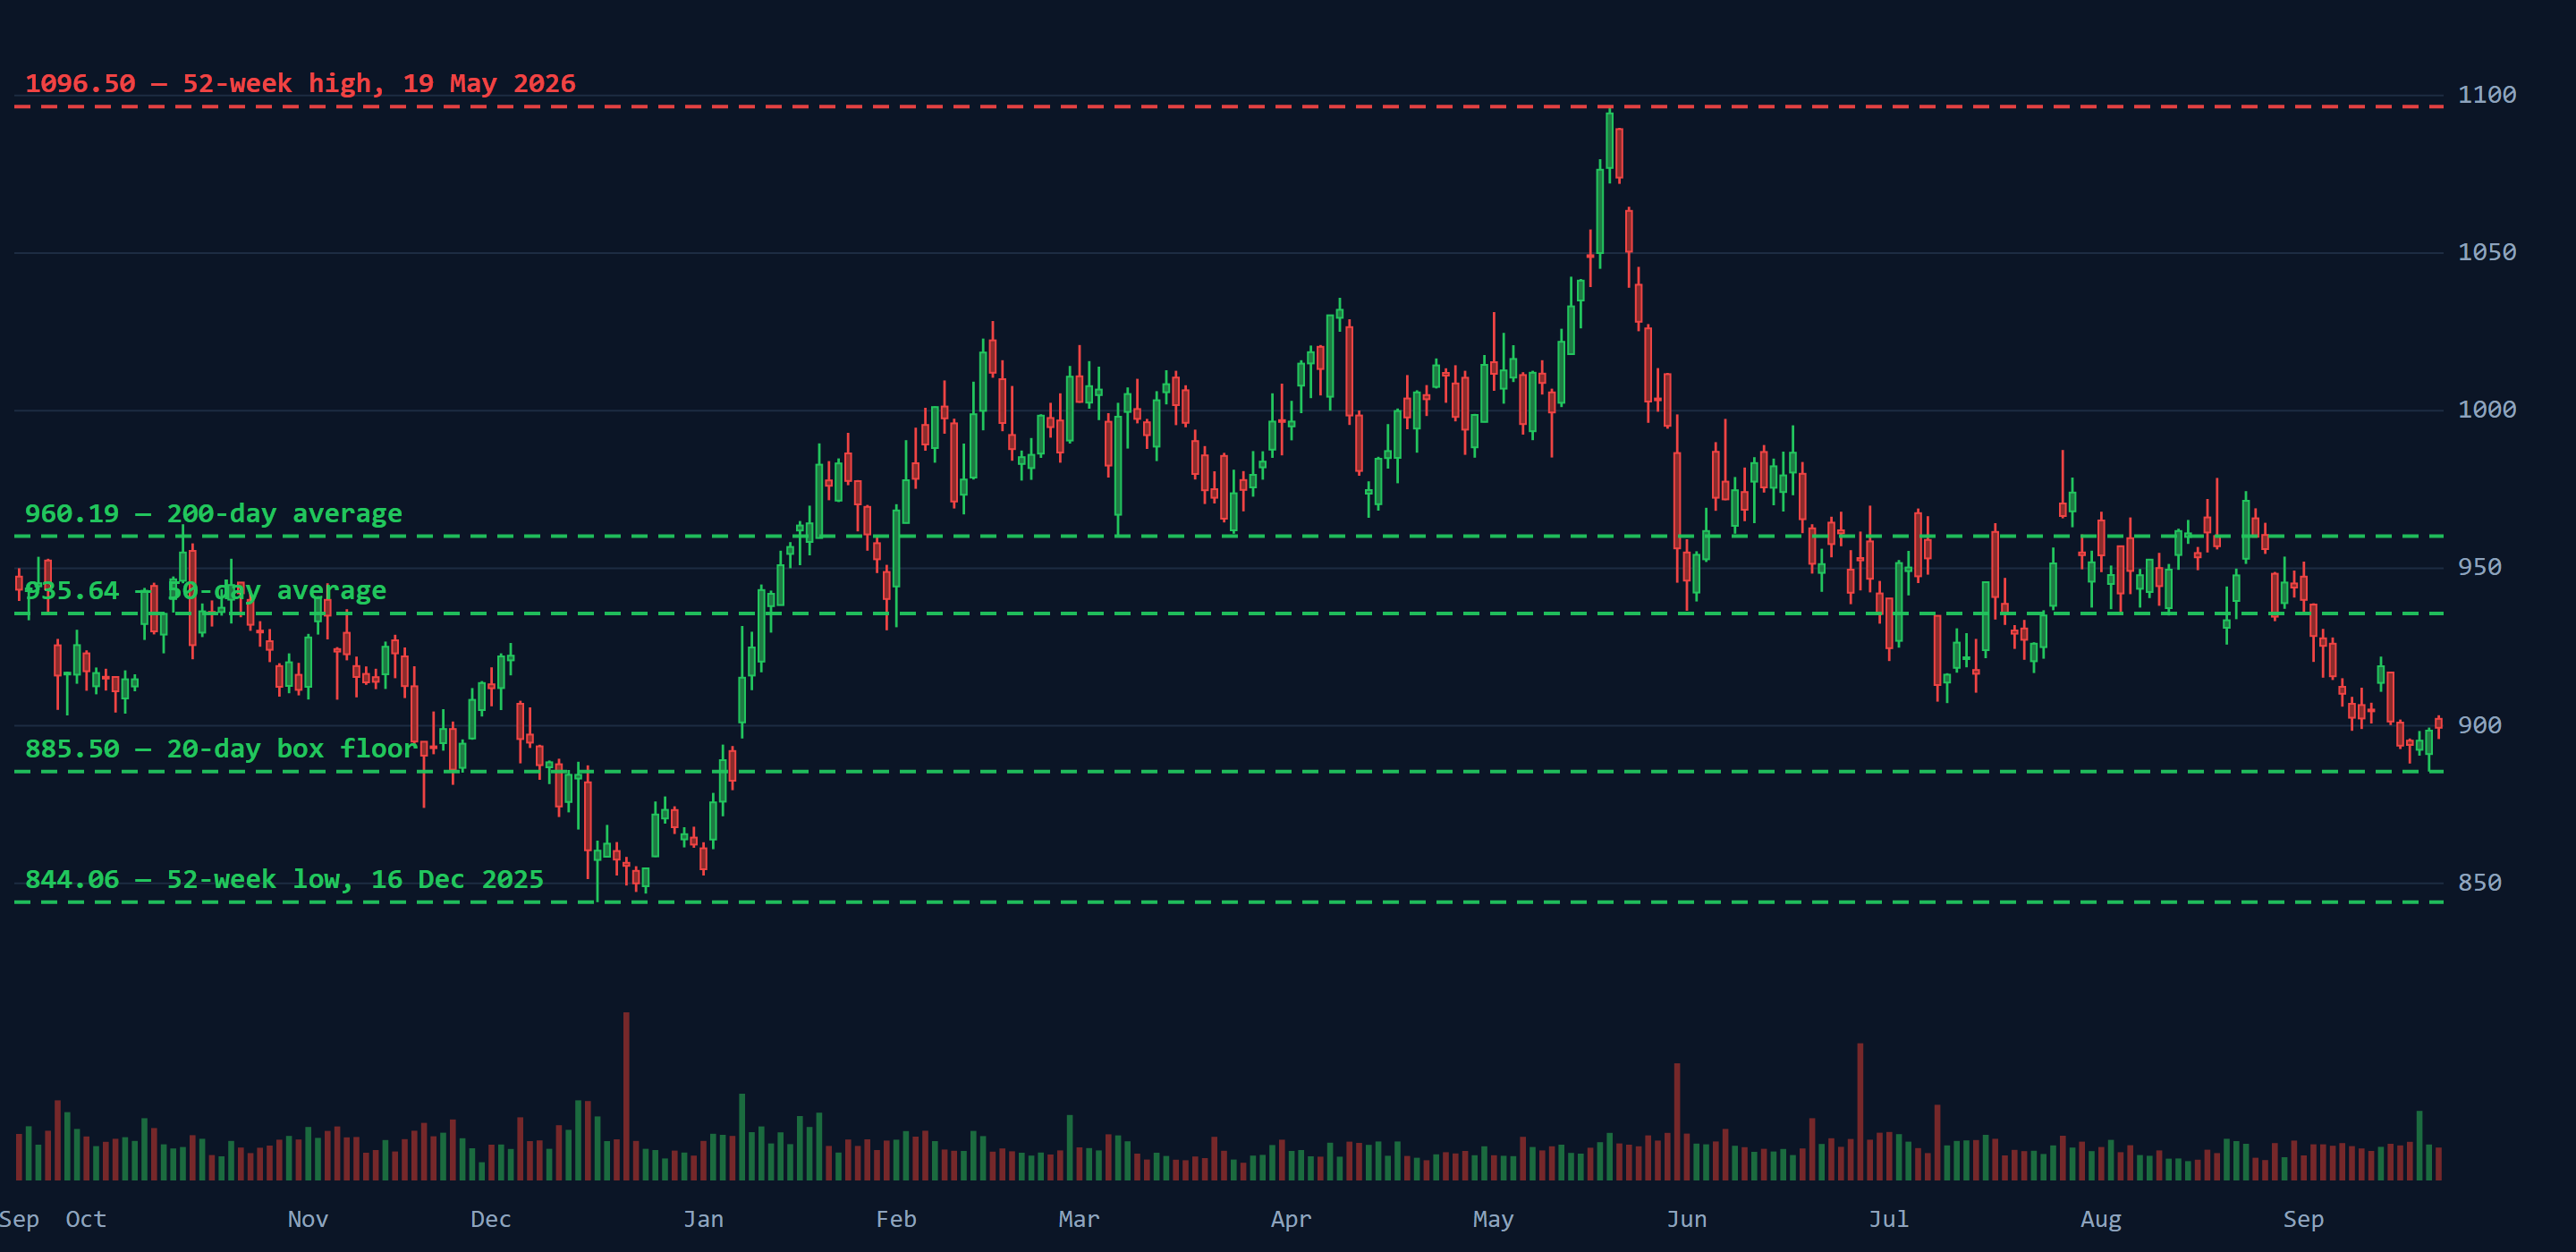
Neither case resolves in one report. Earnings keep growing at a low-double-digit rate, the multiple settles somewhere in the forties, and the share trades on whether each quarter's growth rate is above or below the last one. The $885.50 floor of the 20-day box and the $960.19 200-day average on the chart are the practical boundaries of that argument.
This page does not forecast a price. What it can say is which number will settle the argument, and it is revenue growth, reported quarterly — because tab 4 shows the margin half of the requirement is already being met and the growth half is the one that decides whether 45× is the floor or the ceiling. The next report is tomorrow, 24 September 2026, the sixteen-week fourth quarter: EPS estimate $6.54, revenue estimate $94.86bn, which would be 10.1% above the same quarter last year.
What this method is for: to see whether the company is getting stronger or weaker over years rather than quarters, by reading growth, margin and earnings as one sequence instead of three headlines.
| Period | Revenue | Gross margin | Operating margin | Net income | Net margin | EPS | EBITDA |
|---|---|---|---|---|---|---|---|
| FY2023 | $242.29bn | 12.26% | 3.35% | $6.29bn | 2.60% | $14.16 | $10.72bn |
| FY2024 | $254.45bn | 12.61% | 3.65% | $7.37bn | 2.90% | $16.56 | $12.15bn |
| FY2025 | $275.24bn | 12.84% | 3.77% | $8.10bn | 2.94% | $18.21 | $13.40bn |
| Prior TTM | $268.78bn | — | — | $7.84bn | — | $17.63 | — |
| TTM to Q3 FY2026 | $293.59bn | 12.88% | 3.82% | $8.84bn | 3.01% | $19.88 | $14.47bn |
From $242.29bn in FY2023 to $275.24bn in FY2025 is a compound annual rate of 6.58%. The trailing twelve months grew 9.23%, and the most recent quarter 11.58%. Each window is faster than the longer one before it, which is the opposite of the usual disease of a company this size. For a business adding roughly $25bn of sales a year, it is a genuinely strong sequence and the reason the multiple exists at all.
Net income was $6.29bn in FY2023, $7.37bn in FY2024, $8.10bn in FY2025 and $8.84bn over the trailing twelve months: a compound rate of 13.45% against revenue's 6.58%. EPS tells the same story: $14.16 to $19.88. When profit compounds at twice the rate of sales for three years in a business with a three-per-cent margin, the explanation is arithmetic rather than magic — a fee line that grows without a matching cost of goods lifts the whole margin stack a few tenths at a time, and a few tenths on $290bn is a billion dollars.
Gross margin is up 0.62 points in three years and operating margin 0.47. On the scale this company works at, those are not rounding errors: the operating margin gain alone is worth about $1.4bn a year on today's revenue. The number to follow is the operating line, because gross margin here is partly policy — the company caps its markup — and operating margin is where the fee income and the cost discipline both show.
The rule of 40 is a convention for subscription software, where growth and operating margin trade off against each other at high gross margins. A retailer with a 12.88% gross margin fails it by construction and learns nothing from failing. The equivalent test for this business is simpler: is net income growing faster than revenue? It is, by 12.69% to 9.23%.
Strong on every line we hold, and getting stronger. Revenue accelerating, margins rising, earnings compounding at twice the rate of sales. This method cannot tell you whether the price already knows all of that — that is tab 4's job — and it cannot tell you what the fee line is doing underneath, because we do not hold it.
What this method is for: to ask why the company's profits should still exist in ten years, since anything profitable and unprotected gets competed away.
This is worth being precise about, because the number that proves it looks like a weakness. A gross margin of 12.88% is not what the company can earn; it is what it chooses to earn, by capping its markup and passing the rest of its buying power to the member. The advantage is that its buying power is larger than anyone else's who plays the same game: a short product list bought in enormous volume, sold in large sizes out of a warehouse that costs less to run than a shop. A competitor can copy the format; it cannot copy the volume, and the volume is what sets the price. That is the most durable cost advantage in retail and it has compounded for decades.
Not a brand in the consumer-goods sense — it commands no premium; the point is the opposite. It is a brand in the trust sense: the member believes the price is fair without checking, which is what lets the product list stay short. The company's own private label is the evidence that the trust is real, because a private label only sells at scale when the shopper trusts the shop more than the manufacturer.
A paid annual fee is a switching cost of a modest, deliberate kind: a household that has paid it shops there to justify it, and renewing is easier than deciding. It is not the years-long re-implementation that protects enterprise software. A member can leave at the next renewal and lose nothing but the habit. That is why the renewal rate — which our data does not hold — is the figure this moat lives or dies on, and why every quarter's release states it.
One member's shopping does not make the warehouse more valuable to the next member directly. It does so indirectly, through volume and therefore price, but that is the cost advantage wearing a different name. Scoring it twice would be double counting.
There is none of consequence, and the company's advantage has never depended on any. The technology risk runs the other way: whether somebody else's — delivery at scale — erodes the reason to drive to a warehouse. Tab 5 ranks that.
The competition is three things. The other warehouse clubs, which play the same game with less volume and therefore a slightly worse price. The largest general retailers, which have the volume but not the format or the fee. And online delivery, which does not compete on price for a pallet of anything but competes on the trip. The first two are the pricing threat and the figures say they are not winning; the third is the format threat and the figures cannot see it yet.
Eight, and the reasoning is the argument rather than the number. A cost advantage that has compounded for decades and a membership that turns it into a renewal are together one of the more durable moats in any industry. What holds it below nine is that the switching cost is a habit rather than a lock, and a habit can be broken by a better habit — which is the one risk on tab 5 that the financial figures on tab 2 are structurally unable to warn about in advance.
What this method is for: to separate the company from the price, because a good business bought at the wrong number is a bad investment and the two questions have different answers.
Forty-five times earnings is a growth multiple, on a company that grows revenue at high single digits and earnings at low double digits. A year ago it was 53.5 times: the share was $943.27 and EPS was $17.63. Since then EPS rose to $19.88 and the share fell to $899.41. That is a multiple compressing by about 15% in a year in which the business did nothing but improve, and it is the tension the rest of this panel measures.
Rather than guess the future and discount it, hold the price still and solve for the growth that would justify it. The arithmetic: pick a multiple a mature version of this company might trade at in five years, divide today's price by it to get the EPS that would be needed, multiply by the 444.4m shares to get the net income needed, then divide by today's net margin of 3.01% to get the revenue needed. Compare that revenue with today's $293.59bn.
| If in 5 years it trades at | EPS needed | Net income needed | Revenue needed at today's margin | Implied revenue growth, per year |
|---|---|---|---|---|
| 35× earnings | $25.70 | $11.42bn | $379.4bn | 5.3% |
| 30× earnings | $29.98 | $13.32bn | $442.7bn | 8.6% |
| 25× earnings | $35.98 | $15.99bn | $531.2bn | 12.6% |
| 20× earnings | $44.97 | $19.99bn | $664.0bn | 17.7% |
How to read that table. It does not say the share is expensive or cheap. It says: for the buyer at $899.41 to simply get their money back with the share trading at 30× in 2031, this company has to compound revenue at 8.6% a year for five years and hold today's net margin. It is currently growing at 9.23%, and the margin has risen every year in the table on tab 2 — so both halves of that requirement are being met today. The table only turns demanding at 20×, the multiple of an ordinary retailer, where the price would need 17.7% growth that nothing in the record supports. The whole valuation question is therefore one question: is this a 30× company or a 20× one?
The method asks for an industry-average multiple. Our data does not carry a peer set for this company, so any "discount retail trades at 25×" here would be a number I remembered rather than measured, and the whole value of the table above is that it contains none of those. A reader who wants the peer comparison can build it in the app: open the chart's Key stats tab for two or three comparable retailers and read the P/E line from the same source for each.
What this method is for: to work out what would have to go wrong and how much it would cost, because the size of a loss matters more than its likelihood when the position is large.
Ranked most dangerous first. "Dangerous" here means the product of how likely it is and how much of the share price it would take, not how frightening it sounds.
What this method is for: to ask where the next hundred billion of revenue would have to come from, and whether there is a plausible place for it to come from.
Accelerating, at nearly three hundred billion dollars of scale. The most recent quarter grew faster than the trailing year, which grew faster than the two-year compound rate. Deceleration is the usual disease of a company this size and there is no sign of it in these three numbers. The caveat is that the twelve-week third quarter is the smallest of the year and the sixteen-week fourth quarter reported tomorrow is the one that sets the annual rate.
Tab 4 computed what growth the price assumes; this is the same figure read as an operating question. To reach $442.7bn of revenue by 2031 — the 8.6% compound rate the 30× row needs — this company has to add $149bn of annual revenue in five years, having added $32.95bn in the two years to FY2025 and about $25bn in the last twelve months alone. That is a continuation of the current trajectory, not an acceleration. The growth case rests on the trajectory holding for longer than most retailers manage, which is a smaller claim than most growth cases make.
What this method is for: to look at the share the way the people who move it do, since a private investor is trading against institutions and it helps to know what they are solving for.
A fund manager is not answering "is this a good company". They are answering "does this position help the portfolio I have to report on", and those are different questions with different answers.
The most durable cost advantage in retail, monetised through a fee that makes its earnings compound like a subscription's, currently trading 18% below its high because the market has spent a year deciding how much of a subscription multiple a retailer deserves. The position is a bet that 30× is where that argument stops; the evidence is the quarterly revenue growth rate, and the next reading is tomorrow. Sized for the multiple, not for the company.
What this method is for: to force the strongest version of the argument you disagree with, because the case you cannot state is the one that costs you money.
Both analysts below are arguing from the same figures on this page. That is the exercise: identical data, opposite conclusions, and the reader watching where the disagreement actually is.
Start with the only sequence on this page with no bad year in it: net income $6.29bn, $7.37bn, $8.10bn, $8.84bn. Earnings compounding at 13.45% on revenue compounding at 6.58%, margins up three years running, the last quarter the fastest at 11.58%.
Meanwhile the share is down 4.65% on the year and the multiple has gone from 53.5 to 45. The market has repriced a business that got better. That is the setup, not the warning.
Forty-five is still the multiple of a software company, on a grocer. Look at what it is attached to: 3.01% net margin, 6.58% two-year revenue growth. The earnings growth you are quoting is margin expansion of a few tenths of a point a year on a thin base, and margin expansion has an end. When it ends, earnings grow at the rate of sales — high single digits — and nobody pays 45× for that.
The multiple came down 15% in a year while the company did everything right. What do you think it does the first year the company does something ordinary?
Take your own point to the table on tab 4. At 30× in five years, the buyer today needs 8.6% revenue growth and today's margin. The company is delivering 9.23% and the margin is rising. This is not a heroic assumption — it is the present, extended, at a multiple a third lower than today's.
And the moat is the reason the present extends. A cost advantage that has compounded for forty years does not stop because the multiple was high.
You have chosen the 30× row. Choose the 20× row — the multiple of every other retailer with a three-per-cent margin — and the price needs 17.7% growth for five years, which this company has never done. The whole case is a claim about which row the market will use in 2031, and the last twelve months are the market moving down the table one row at a time.
The moat protects the earnings. It has never protected the multiple; nothing does.
Then judge it on the thing neither of us can argue with: the company beat the EPS estimate in four of the last five reported quarters, and tomorrow's estimate of $6.54 is 11.4% above last year's fourth quarter — a bar the business has cleared every year in the table.
Four beats of +0.94%, +1.21%, +5.39% and +0.66% — and then a miss of −1.40%, after which the share fell 3.91% on triple volume. The share was lower two sessions after three of the last four reports. At 45×, a beat is the expectation and a miss is the event. Tomorrow's bar is not $6.54; it is whatever makes the market stop moving down the table.
They agree on every figure. They disagree about one question: is the multiple that of a subscription business or of a retailer? The bull says the earnings behave like the first and so should the price; the bear says the balance sheet of the business — three cents on the dollar — is the second, and the market has spent a year remembering it. Neither has proof, because the evidence is a series of quarterly growth rates that has not been reported yet. That is why tab 1 nominates revenue growth as the number to watch, and why an investor who cannot say which multiple they believe in is holding a position in the market's mood rather than in the company.
What this method is for: to read a quarter as evidence rather than as news — what was expected, what arrived, and what the price did about the difference.
A beat on revenue and a miss on earnings — the first EPS miss in the five reports our data covers, by seven cents. On the headline, a mixed quarter.
Revenue up 11.58%; net income up 15.19%; operating margin of 3.99% against 3.77% for the whole of FY2025. Underneath the seven-cent miss was the best-growing quarter in the table, with the highest operating margin. A reader who stopped at "missed by seven cents" would have learned the opposite of what happened to the business — and the market, which read the seven cents, took the share down 3.91% the next session on 3.58 times average volume, the second largest move of the year. That is not a comment on the quarter. It is a comment on the multiple.
| Reported | EPS estimate | EPS actual | Surprise | Close before | Close on the day | By the next close |
|---|---|---|---|---|---|---|
| 28 May 2026 | $5.00 | $4.93 | −1.40% | $1,003.69 | $995.20 (−0.85%) | $956.32 (−4.72%) |
| 5 Mar 2026 | $4.55 | $4.58 | +0.66% | $1,006.74 | $982.57 (−2.40%) | $998.10 (−0.86%) |
| 11 Dec 2025 | $4.27 | $4.50 | +5.39% | $874.41 | $884.48 (+1.15%) | $884.47 (+1.15%) |
| 25 Sep 2025 | $5.80 | $5.87 | +1.21% | $945.27 | $943.31 (−0.21%) | $915.95 (−3.10%) |
| 29 May 2025 | $4.24 | $4.28 | +0.94% | — | — | — |
The company reports after the close, so "close on the day" is the price before the report and "by the next close" is the market's actual answer, cumulative from the close before.
The size of the surprises is worth reading as a sequence on its own: +0.94%, +1.21%, +5.39%, +0.66%, −1.40%. A company that clears the bar by a cent or two for years is a company whose estimates have caught up with it, and the first miss in that pattern is what a market at a high multiple is waiting for.
24 September 2026, after the close. The sixteen-week fourth quarter and the full year. Estimates: EPS $6.54 (11.4% above last year's $5.87), revenue $94.86bn (10.1% above last year's $86.16bn). Based on the table above, the estimate is the least interesting thing about it: the share has fallen after reports that beat by a per cent. What the market is deciding is whether 10% growth is the new rate or the peak of the acceleration.
What this method is for: to put the other nine together and reach a decision — which, on this site, means reaching your decision. This page does not issue a verdict, and the next paragraph explains why that is a position rather than a dodge.
| Method | Its conclusion | Direction |
|---|---|---|
| 1 · Full analysis | Earnings up 12.76%, share down 4.65%; the multiple did all the work | Unresolved |
| 2 · Financials | Revenue accelerating, margins up three years, profit compounding at twice the rate of sales | Positive |
| 3 · Moat | A cost advantage turned into a renewal, 8/10 — but a habit, not a lock | Positive |
| 4 · Valuation | 30× needs 8.6% growth, which is being delivered; 20× needs 17.7%, which never has been | Depends on the row |
| 5 · Risk | The multiple is the biggest risk and the only one firing | Negative |
| 6 · Growth | Not decelerating; the most recent quarter was the fastest | Positive |
| 7 · Institutional | Ownable at size, defensive by beta — and 20.6 points behind the index in a year | Mixed |
| 8 · Bull vs bear | One disagreement: a subscription multiple or a retailer's | Unresolved |
| 9 · Earnings | Four beats, one miss, three falls — the price moves on the multiple, not the quarter | Negative |
Two numbers bound it, and both are on the chart. $885.50 is the floor of the 20-day box, 1.55% under the close, and the last line before the December low at $844.06. $960.19 is the 200-day average, with the box top less than a per cent above it — the level the price lost in early September and would have to regain for the chart to say anything other than "down". Between them, the argument continues. The single scheduled event that could resolve it is tomorrow, 24 September 2026, and the table on tab 9 says the first two sessions after it have not been kind.
It reduces to one question, and tab 8 established that both sides already agree it is the question: does a retailer whose earnings compound like a subscription's keep a subscription's multiple? If it does, 30× in five years is a floor, the growth the price needs is the growth the company delivers, and the last year's fall was the buying opportunity the bull describes. If it does not, 20× is where retailers live, and 45× is a long way to fall from while the business does nothing wrong.
These are the four the nine panels above cannot answer for you, because the answers are about you rather than about the company:
What SigniBull is actually for. You can hold this position on paper here, at the market's own prices, with a trade log nobody can edit, and find out over the next four quarters whether your answer to the multiple question was right — before it is a decision about money. Open a free account and record it before tomorrow's report.